While gatefold mechanisms were already used in the 1100s, one of the first movable paper mechanisms was a volvelle created by Benedictine Monk Matthew Paris to calculate the dates of Christian holidays in his book Chronica Majorca (1236-1253, see left image above). Volvelles are paper discs or rings placed on top of each other that rotate around a string or rivet. Many other types of paper mechanisms have been invented since then, such as flaps, which were used in anatomy books starting from […]
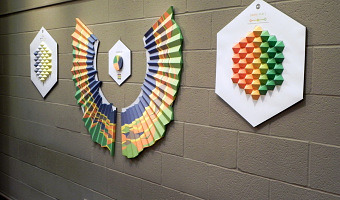
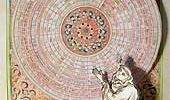
While gatefold mechanisms were already used in the 1100s, one of the first movable paper mechanisms was a volvelle created by Benedictine Monk Matthew Paris to calculate the dates of Christian holidays in his book Chronica Majorca (1236-1253, see left image above). Volvelles are paper discs or rings placed on top of each other that rotate around a string or rivet. Many other types of paper mechanisms have been invented since then, such as flaps, which were used in anatomy books starting from the 16th century (see second image above, 17th century, and third image, undated). Only in the 19th century did movable books started to be used for entertainment purposes and for children. Ellen G.K. Rubin (aka the pop-up lady) has a rich website and a must-watch talk about the history of pop-up and movable books. For a modern example of a pop-up book used to convey data, see our entry 2013 - Pop-Up Infographics. Sources: Ellen G.K. Rubin, Pop-up Lady Website. Mugdha Kale, Pop-Up Design. E.D.W. Lynch (2011) Animated Anatomies, An Exhibition of Antique Medical Pop-Up Books. (with link to a video) Left and middle image from popuplady.com, right image from laughingsquid.com.
Added by: Pierre Dragicevic, sent by: Benjamin Bach.
Category:
Enabling technology
Tags:
anatomy, book, mechanical interaction, paper, pop-up