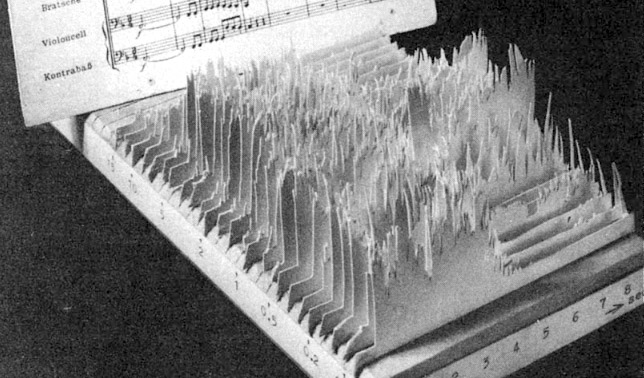
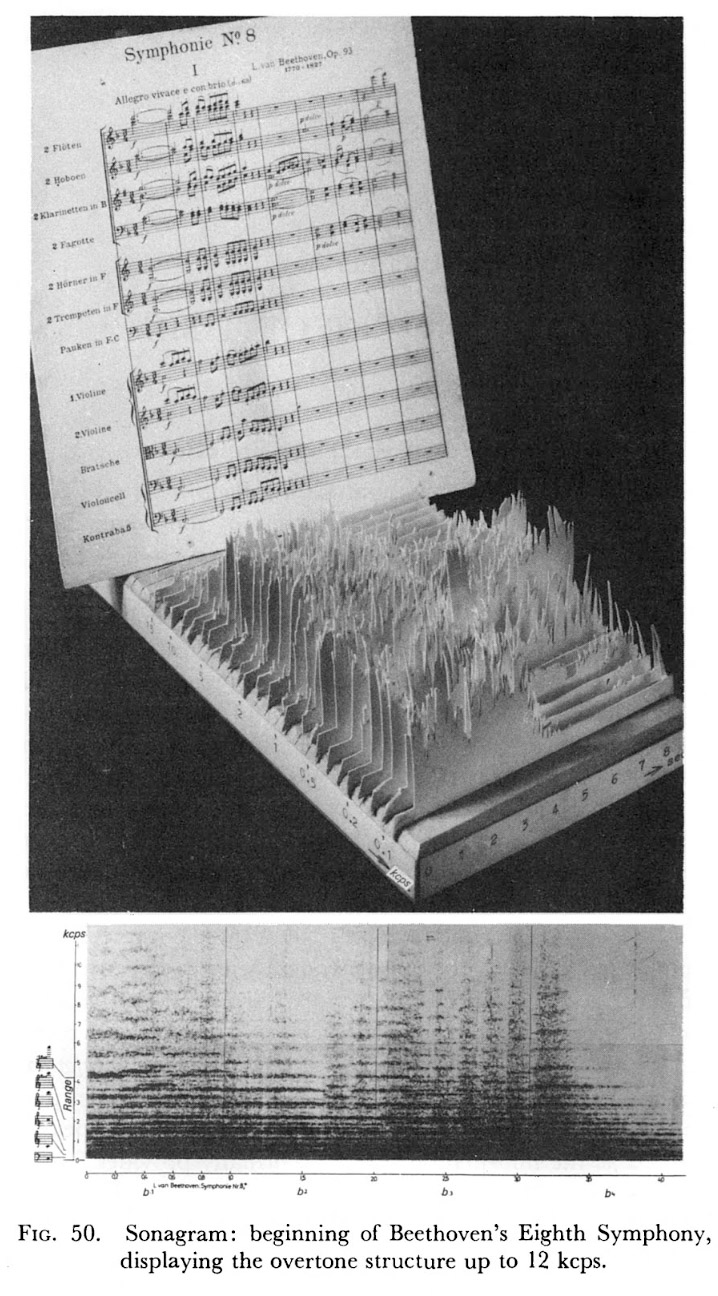
The object on the left may be one of the first sound sculptures. It appears in a 1960 book by German acoustician and musicologist Fritz Winckel (click on the middle image to see the full page). It is a physical 3D spectrogram showing a frequency analysis of an 8-second recording of Beethoven's Eighth Symphony. The left axis is frequency, the bottom/right axis is time, and the vertical axis is the strength of a particular frequency at a particular time.
The figure caption uses the term "sonagram", which is how spectrograms were called back in the 1960s. This term originates from the first audio spectrometer called the "Sona-Graph" and commercialized in 1951. The figure caption also uses the unit "kcps" which means kilocycles per second, and is now called kilohertz (kHz).
Winckel's book provides no information about the origin of the physical spectrogram, and does not explain how it was built.
Nowadays 3D spectrograms are frequently rendered on computers. The video on the right shows an animated 3D spectrogram.
Sources:
- Fritz Winckel (1967) Music, Sound and Sensation: A Modern Exposition, p.76. The original 1960 book is in German, but the scan available on archive.org does not feature the image.
- Nathan Pieplow (2009) A Brief History of Spectrograms.
- Wikipedia, Cycle per second.