Humanity has been gazing at light from distant stars since time immemorial. But in 2015, our ability to understand the University achieved a major milestone, when ripples in Spacetime itself - instead of light - told the tale of an ancient, cataclysmic collision between black holes. The Laser Interferometer Gravitational-Wave Observatory (LIGO) is an experimental system of almost unbelievable sensitivity. Using interferometer arms four kilometers long, it can detect changes in length as tiny as 1/10,000 the width of a proton.
Over a billion years ago, two huge black holes, with a combined mass 60 times that of our Sun, spiraled into each other. This event shook the very fabric of space and time, and about three solar masses were converted completely into energy in the form of gravity waves. These waves have been travelling outwards in all directions at the speed of light, until they were noticed by LIGO, on 14 Sept 2015, first at the installation in Hanford, WA, and milliseconds later at Livingston, LA (GW150914).
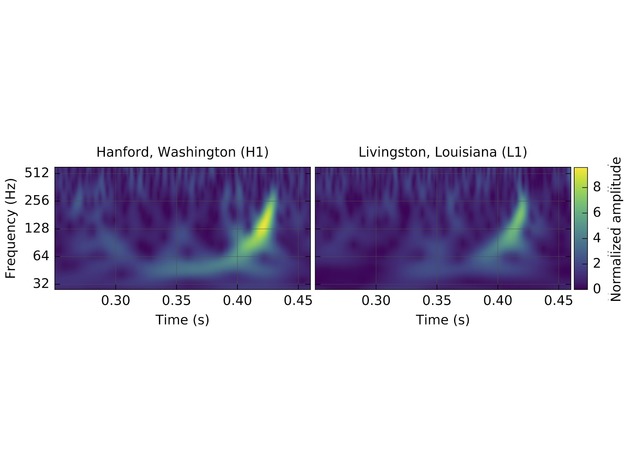
The LIGO team released a 2D spectrogram of the data, showing how the intensity of the gravity waves at different frequencies changed over the course of the event. In this case, the x-axis is time, the y-axis is frequency, and the intensity is indicated by the color. As predicted by Einstein's theory of General Relativity, the coalescing of the black holes involved a "ringdown" increase in intensity of the high-frequency components as they spiraled together faster and faster.
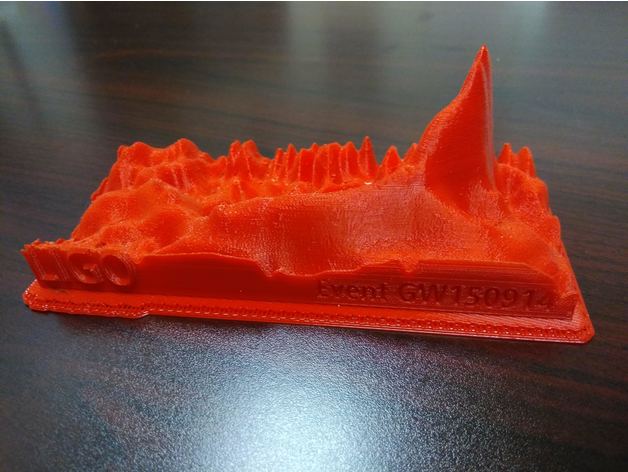
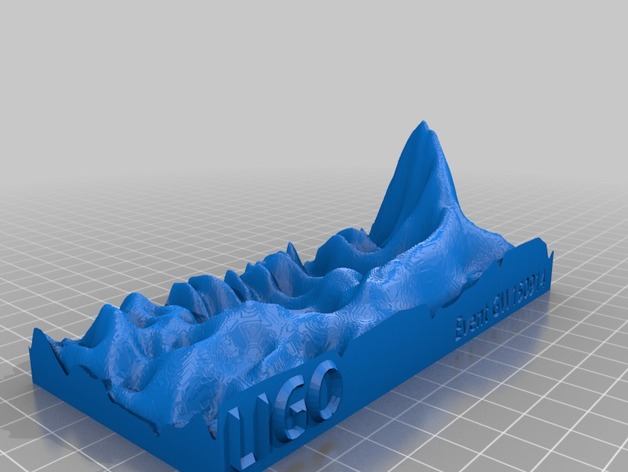
I (Louis R. Nemzer) converted this spectrogram into a 3D-printed model. This way, the peak is much more apparent, and the primary signal, as well as the background noise, is much easier to appreciate. This event has paved the way for a new era in astronomy, in which gravity wave signals, along with light, will let us peer deeper into the vastness of Space.
Sources:
- "Gravity Wave Spectrogram" by Louis R. Nemzer hosted on Thingiverse
- Data from the LIGO Open Science Center