Tag: physics

1787 – Chladni Plates

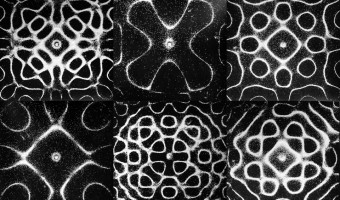
In 1787, German physicist and musician Ernst Chladni published a technique to visualize the modes of vibration of a rigid surface. Chladni's technique [...] consisted of drawing a bow over a piece of metal whose surface was lightly covered with sand. The plate was bowed until it reached resonance, when the vibration causes the sand to move and concentrate along the nodal lines where the surface is still, outlining the nodal lines. The patterns formed by these lines are what are now called […]

Added by: Pierre Dragicevic. Category: Measuring instrument  Tags: acoustics, embedded, physics, science, sound


1866 – Kundt's Tube

Kundt's tube is an apparatus invented in 1866 by German physicist August Kundt for measuring the speed of sound. It mostly consists of a transparent tube of adjustable length with powder in it. Sound is produced at one end of the tube, and the tube's length is adjusted until the sound becomes louder, indicating the tube is at resonance and the sound forms a standing wave. The powder then accumulates at the nodes of the standing wave, where is no vibration. The wavelength of the sound can be […]

Added by: Pierre Dragicevic. Category: Measuring instrument  Tags: physics, science, sound


1968 – Grace Hopper's Nanoseconds

Grace Hopper, a computer scientist and US Navy Rear Admiral, used wire to visualise very short durations of time in computing. Each wire is cut to the maximum distance that light or electricity can travel in a nanosecond, one billionth of a second. She wanted programmers to understand 'just what they're throwing away when they throw away a millisecond', and describes using them to help military commanders understand why signals take so long to relay via satellite. This lecture was given at MIT […]

Added by: Kim Plowright. Category: Passive physical visualization  Tags: wire, physics, science, single-datum, light


2002 – Bathsheba Grossman's Crystal Engravings

Artist Bathsheba Grossman has been 3D printing mathematical surfaces as early as 1997. In 2002 she started to use subsurface laser engraving to produce 3D physical visualizations of data from astronomy, biology, and physics. Left image: a piece of DNA molecule. Right image: a 3D map of our nearby stars. The artist explains to us: This medium excels at imaging less structural data such as disconnected volumes, non-compact point clouds, and the convoluted strands of proteins. It works by […]

Added by: Pierre Dragicevic & Bathsheba Grossman. Category: Passive physical visualization  Tags: 3d printing, astronomy, biology, digital fabrication, math, physics, science, subsurface laser engraving


2017 – Gravity Wave Spectrogram - LIGO

Humanity has been gazing at light from distant stars since time immemorial. But in 2015, our ability to understand the University achieved a major milestone, when ripples in Spacetime itself - instead of light - told the tale of an ancient, cataclysmic collision between black holes. The Laser Interferometer Gravitational-Wave Observatory (LIGO) is an experimental system of almost unbelievable sensitivity. Using interferometer arms four kilometers long, it can detect changes in length as tiny as […]

Added by: Louis R. Nemzer. Category: Passive physical visualization  Tags: astronomy, Gravity Waves, physics, science