Grace Hopper, a computer scientist and US Navy Rear Admiral, used wire to visualise very short durations of time in computing. Each wire is cut to the maximum distance that light or electricity can travel in a nanosecond, one billionth of a second. She wanted programmers to understand 'just what they're throwing away when they throw away a millisecond', and describes using them to help military commanders understand why signals take so long to relay via satellite. This lecture was given at MIT […]
Grace Hopper, a computer scientist and US Navy Rear Admiral, used wire to visualise very short durations of time in computing. Each wire is cut to the maximum distance that light or electricity can travel in a nanosecond, one billionth of a second. She wanted programmers to understand 'just what they're throwing away when they throw away a millisecond', and describes using them to help military commanders understand why signals take so long to relay via satellite.
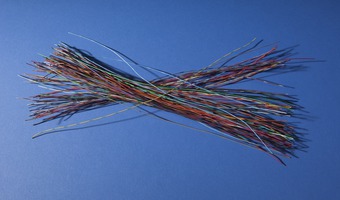
This lecture was given at MIT Lincoln Laboratory on 25 April 1985 (video above); she used the short wires as a visual teaching method from the late 60s. A bundle of her nanosecond wires are in the Smithsonian Museum (left photo above).
From the Smithsonian Collection Website, under a CC0 license:
This bundle consists of about one hundred pieces of plastic-coated wire, each about 30 cm (11.8 in) long. Each piece of wire represents the distance an electrical signal travels in a nanosecond, one billionth of a second. Grace Murray Hopper (1906–1992), a mathematician who became a naval officer and computer scientist during World War II, started distributing these wire "nanoseconds" in the late 1960s in order to demonstrate how designing smaller components would produce faster computers.
The "nanoseconds" in this bundle were among those Hopper brought with her to hand out to Smithsonian docents at a March 1985 lecture at NMAH. Later, as components shrank and computer speeds increased, Hopper used grains of pepper to represent the distance electricity traveled in a picosecond, one trillionth of a second (one thousandth of a nanosecond).Reference: Kathleen Broome Williams, Grace Hopper: Admiral of the Cyber Sea, Annapolis, MD: Naval Institute Press, 2004.
Grace Hopper (1906-1992) was one of the first programmers of the Harvard Mark I computer, and invented compilers and machine independant programming languages, which underpin most of modern computing. She earned a Ph.D. in mathematics from Yale University and was a professor of mathematics at Vassar College before joining the Navy reserves during World War II. She was behind the development of COBOL in the 1960s; was the first person to use the phrase 'bug' for programming faults, and was posthumously given the Presidential Medal of Freedom in 2016. [Biography summarised from Wikipedia]
Added by: Kim Plowright.
Category:
Passive physical visualization
Tags:
wire, physics, science, single-datum, light