Tag: walkable

1500 – Plans-Reliefs

The first terrain/city models date back from the 16th century and were created for military purposes. Left image: a plan-relief of Bayonne, created by Sébastian Vauban (1633–1707), a famous fortification engineer of King Louis XIV. Right image: a plan-relief of Grenoble from 1848. These scale models were highly prized for the tactical advantage they brought, and they were also shown around for dissuasive purposes. “Il y a un relief de Namur dans les Tuileries, je vous demanderai d'avoir la […]

Added by: Pierre Dragicevic. Category: Physical model  Tags: cartographic, plan relief, terrain model, walkable


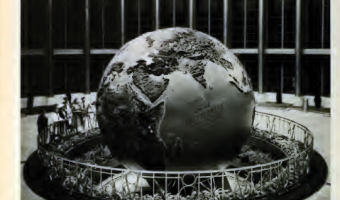
1934 – Ford's Globe

A large rotating relief globe showing Ford company's industrial sites around the word, exhibited at the Chicago World's Fair in 1934. Sources: Willard Cope Brinton (1939) Graphic Presentation, p. 160. The Henry Ford Blog (2013) Ford at the Fair. More photos from the Henry Ford Online Collection.

Added by: Pierre Dragicevic. Category: Physical model  Tags: Brinton, cartographic, globe, walkable


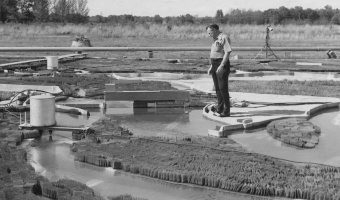
1949 – Mississippi River Basin Model

As a response to devastating floods of the Mississippi river in the early 1900s, the US Army Corps of Engineers built a large-scale hydraulic model of the entire river system. The model, 2.5 times the size of Disneyland, allowed them to design better flood control infrastructures and to eventually save millions of dollars. In 1973, the physical model ceased to be used and was replaced by computer models. Nevertheless, mathematical equations still cannot capture all the complexity of river […]

Added by: Pierre Dragicevic, sent by: Wesley Willett. Category: Physical model  Tags: cartographic, hydraulic, physical computation, terrain model, walkable, water


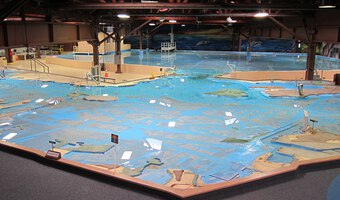
1957 – US Army Corps of Engineers San Francisco Bay Model

A working hydrodynamic model of San Francisco Bay and the surrounding waterways, with tides. It is still open to the public as a demonstration, although it is no longer used for research. Also see our related entry 1949 – Mississippi River Basin Model. Source: Wikipedia U.S. Army Corps of Engineers Bay Model.


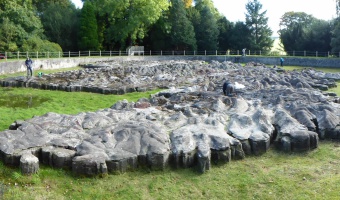
1979 – Great Polish Map of Scotland

The "Great Polish Map of Scotland" is a 50 x 40 m concrete terrain model of Scotland. It was built by a Polish sergeant who stationed in Scotland during WWII and ended up living there. It is claimed to be the world's largest terrain model, although the Chinese built a 900 x 700 m model in 1999. Source: Atlas Obscura. Great Polish Map of Scotland.

Added by: Pierre Dragicevic, sent by: Benjamin Bach. Category: Physical model  Tags: cartographic, scotland, terrain model, walkable


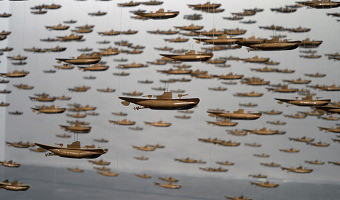
1987 – All the Submarines of the United States of America

This installation from American artist Chris Burden shows the 625 submarines of the US fleet from the late 1890s to the late 1980s. The cardboard models have been suspended at different heights to look like a school of fish. Also see our other entries on single-datum physical visualizations. Sources: Found on Loren Madsen's lecture slides Art as Information – Information as Art. Wikipedia article on Chris Burden. Photo from Giorgia Valli, Grey Magazine.

Added by: Pierre Dragicevic. Category: Passive physical visualization  Tags: installation, single-datum, submarines, walkable


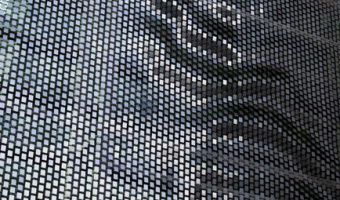
1996 – Ned Kahn's Wind-Visualizing Facades

Since 1996, Nothern California artist Ned Kahn creates large-scale installations that visualize wind patterns. The left image shows Wind veil (2000), a facade of a parking garage covered with 80,000 small aluminum panels that are hinged to move freely in the wind. The right video shows Wind arbor (2011), a facade of a hotel lobby in Singapore covered with a cable net structure composed of a half a million hinged elements. Sources: List of Ned Kahn's wind sculptures on his website. David Mather […]

Added by: Pierre Dragicevic, sent by: Samuel Huron. Category: Passive physical visualization  Tags: embedded, facades, wind, wind sculpture, walkable


1999 – World's Largest Solid Terrain Model

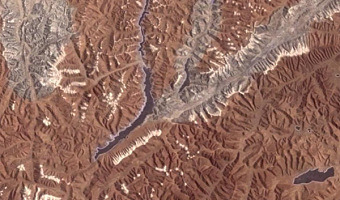
In 2006, a mysterious 900x700m solid terrain model with military facilities was discovered by a German Google Earth user next to the Chinese town of Huangyangtan. It was quickly identified as a 1:500 replica of a disputed area in Tibet between China and India 2400km away, with perfectly matching orientation. Chinese authorities claimed the model was built 7-8 years earlier as a tank training facility. It is unclear whether the right image represents the same model. Sources: Newswatch (2011) The […]

Added by: Pierre Dragicevic. Category: Physical model  Tags: cartographic, large-scale, military, pragmatic, terrain model, walkable


2004 – Of All the People in All the World: Stats with Rice

Since around 2004 the British group of artists Stan’s Cafe is creating data landscapes all over the world by mapping each grain of rice to a person in order to convey various statistics such as city populations or deaths in the holocaust. The size and theme of the show change depending on the location. The largest one involved 104 tons of rice. Rice is weighted manually in small quantities and manually poured over piles. This labor-intensive process is part of the show. Sources: Stan's […]


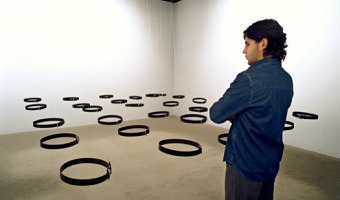
2004 – Array of Belts Visualize Public Presence

Standards and Double Standards is an interactive installation that consists of 10 to 100 fastened belts that are suspended at waist height from stepper motors on the ceiling of the exhibition room. Controlled by a computerized tracking system, the belts rotate automatically to follow the public, turning their buckles slowly to face passers-by. When several people are in the room their presence affects the entire group of belts, creating chaotic patterns of interference. Non-linear behaviours […]

Added by: Karine Charbonneau. Category: Interactive installation  Tags: kinetic sculpture, presence, tracking, walkable


2006 – RoomQuake: Earthquake Visualization for the Classroom

Styrofoam balls hung from classroom ceiling representing the epicenters (location), magnitudes (diameter and color), and depths (length of the string) of a series of simulated earthquakes in a fifth grade classroom. Source: Tom Moher (2006) Embedded Phenomena: Supporting Science Learning with Classroom-sized Distributed Simulations.

Added by: Pierre Dragicevic, sent by: Tom Moher. Category: Passive physical visualization  Tags: earthquake, education, hand-made, styrofoam, walkable


2006 – Pulse Room: Light Bulbs Show Heart Beats

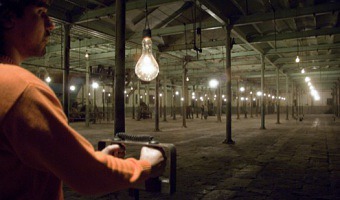
Pulse Room is an interactive installation featuring one to three hundred clear incandescent light bulbs, 300 W each and hung from a cable at a height of three metres. The bulbs are uniformly distributed over the exhibition room, filling it completely. An interface placed on a side of the room has a sensor that detects the heart rate of participants. When someone holds the interface, a computer detects his or her pulse and immediately sets off the closest bulb to flash at the exact rhythm of his […]

Added by: Karine Charbonneau. Category: Interactive installation  Tags: biometrics, incandescent lightbulbs, Pulse, walkable


2007 – Global Cities: Elevation Maps of City Population

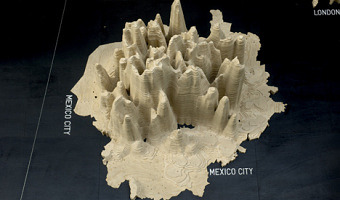
Large-scale physical density models where plywood forms represent the populations of 12 of the world’s major urban centres. Made by a team of designers and architects led by Professor Richard Burdett. Source: Eliza Williams (2007) Global Cities at Tate Modern. Right photo by Stefan Geens.

Added by: Pierre Dragicevic. Category: Passive physical visualization  Tags: cartographic, data sculpture, large-scale, population, walkable


2013 – Walkable Age Pyramid

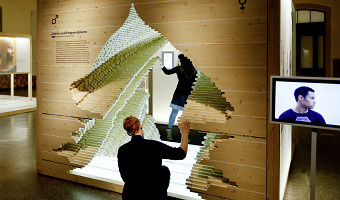
A walkable age pyramid of the German population. It was part of an exhibition on demographics by Atelier Brückner. The sculpture gives an impression how the distribution of age groups shifted between 1950 and 2010. For example, it shows how two world wars took out certain age groups and the lasting effect of the "Pillenknick" (the drop of birth rates due to the wide availability of "the pill"). Sources: Left photo: front view (time goes from the front to the back) picture taken by Michael […]

Added by: Yvonne Jansen. Category: Passive physical visualization  Tags: age pyramid, data sculpture, demographics, walkable


2013 – Population Density Emerging from Walls

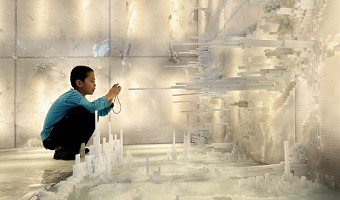
Two Yale architects created a room-sized physical visualization of world population density folded into itself: Hsiang and Mendis then turned that spatial visualization into a physical installation at the 2011 Chengdu Biennale in China. They modeled the population distribution of the entire world in a kind of inverted map that visitors could walk into, inside a 10-by-10-by-10 foot room, with North America on the ceiling, Asia on one wall, Africa on another (see also the little boy in the above […]

Added by: Pierre Dragicevic. Category: Passive physical visualization  Tags: cartographic, data sculpture, population density, walkable


2013 – Network of the German Civil Code

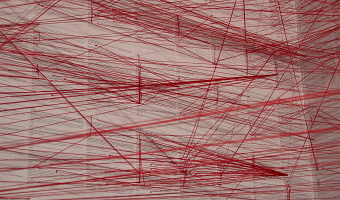
A room-filling visualization by Oliver Bieh-Zimmert (Visual Telling) that illustrates the patterns of references within the German civil code. Each red thread stands for a reference to another paragraph. Source: you can find more info and images on the visual telling website.

Added by: Yvonne Jansen, sent by: Pierre Dragicevic - Benjamin Bach. Category: Passive physical visualization  Tags: network, room-sized, walkable


2014 – 888,246 Ceramic Poppies to Commemorate Fallen Soldiers in WW1

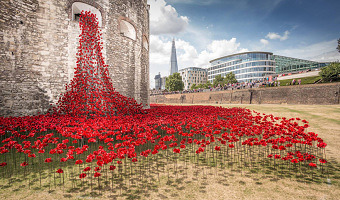
Don't miss the major art installation Blood Swept Lands and Seas of Red at the Tower of London, marking one hundred years since the first full day of Britain's involvement in the First World War. Created by ceramic artist Paul Cummins, with setting by stage designer Tom Piper, 888,246 ceramic poppies will progressively fill the Tower's famous moat over the summer. Each poppy represents a British military fatality during the war. The poppies will encircle the iconic landmark, creating not only a […]

Added by: Yvonne Jansen, sent by: Dan Hagon. Category: Passive physical visualization  Tags: ceramics, deaths, ephemeral, remembrance day, single-datum, walkable


2015 – Dan Gilbert's TV Ads

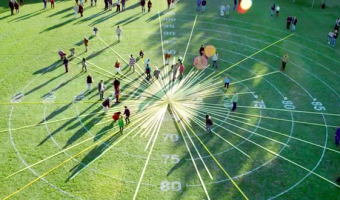
The famous psychology professor Dan Gilbert made a series of TV commercials for the insurance company Prudential, together with Ray Del Savio from Droga5 and Colin McConnell from Prudential. These TV commercials make a clever use of participatory physical visualizations to demonstrate and explain human biases in financial planning. Ribbon Experiment (left image): Dan Gilbert asks bystanders to estimate how much money they will need to retire. He then gives each of them a ribbon and asks them to […]

Added by: Pierre Dragicevic. Category: Passive physical visualization  Tags: participatory, storytelling, walkable


2016 – Walkable Collaboration Network

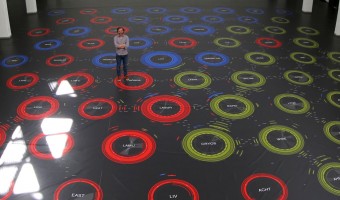
Designer Dario Rodighiero created a large (15x15m) walkable visualization showing scientific relationships between researchers and laboratories at the ENAC school of EPFL in Switzerland. The visualization was printed on tarpaulin, a heavy covering employed for trucks. Two years before, Dario created a coauthorship network visualization for the Digital Humanities 2014 conference. He initially considered showing a large poster, but since sticking posters was not allowed at the conference center, […]

Added by: Pierre Dragicevic, sent by: Benjamin Bach. Category: Uncertain  Tags: collaboration, network, walkable


2021 – Walkable Bar Chart

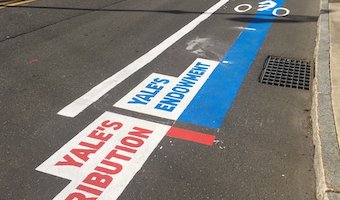
A bar chart conveying two quantities, one of which is clearly larger. The activists and artists at the Respect New Haven rally yesterday offered this stunning graphic to visualize Yale's $32 Billion endowment compared to its paltry $13 million contribution to the city of New Haven...a FRACTION of the taxes it would pay if properly assessed. Also see our other entries on walkable physical visualizations. Source: Tweet from Davarian L. Baldwin.

Added by: Pierre Dragicevic & Yvonne Jansen, sent by: Benjamin Bach. Category: Passive physical visualization  Tags: walkable, city, politics, taxes, bar chart, street, paint