Tag: education

1750 – George Adams' Solid Geometry Models

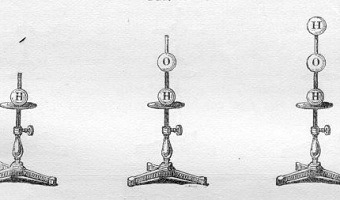
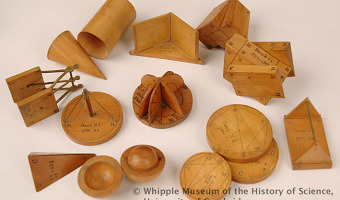
During the 18th century, instrument maker George Adams built and sold solid 3D geometric models as educational complements to the 2D images found in Euclid's Elements of Geometry. As argued by a 18th-century author: It is almost as necessary as in mechanics, to exhibit the objects, whose qualities are to be taught; and to call in the joint assistance of the hands and eyes. According to the Whipple Museum of the History of Science, authors were already experimenting with paper models soon after […]

Added by: Pierre Dragicevic. Category: Physical model  Tags: education, geometry, science, wooden


1865 – Hofmann's Croquet Ball Models

August Wilhelm Hofmann was the first to introduce physical representations of molecules into lectures during his Friday Evening Discourses presentation "On the Combining Power of Atoms" at London's Royal Institution of Great Britain in . He introduced a colored set of four croquet balls to represent atoms (hydrogen, oxygen, chlorine and nitrogen), implanted with a fixed number of sticks corresponding to each atom's valence. Thus we distinguish the chlorine atom as univalent, the atom of oxygen […]

Added by: Fanny Chevalier. Category: Uncertain  Tags: chemistry, education, molecules, pragmatic, science


1880 – Klein's Mathematical Plaster Models

In the 19th century, mathematicians became interested in the question how mathematical functions look like. Felix Klein, a German mathematician, had several of such physical models in his lab in Göttingen, and popularized them in America when he brought a boatload to the World's Fair in Chicago in 1893. The photo above shows a model of a Clebsch surface from 1880, designed and presumably built by Adolf Weiler, Klein's grad student. It is kept today at the University of Göttingen. Sources: […]

Added by: Yvonne Jansen & Pierre Dragicevic, sent by: Saiganesh Swaminathan. Category: Physical model  Tags: education, mathematical functions, plaster


1901 – Davenport's Physical Distributions

In 1901, biologist Charles Davenport "built" physical visualizations that show the distributions of features of objects and people. These visualizations were made out of the objects and the people themselves. The purpose was to explain the notion of statistical distribution to a lay audience. On the left image, seashells are piled up according to how many ribs they have. On the middle image, students are arranged in bins according to their height. On the right image, they are simply sorted. […]


1949 – Moniac: A Hydromechanical Machine to Teach Economics

The MONIAC or Phillips machine is a hydromechanical analog computer built to teach basic economical principles using colored water flowing in transparent pipes. The machine was built in 1951 after electrical-engineer-turned-economist William Phillips and his economist colleague Walter Newlyn realized that flows were used as a metaphor to teach economics, but have never been made physical. Phillips is also known for his eponymous curves. Several MONIACs were built, and a working one is […]

Added by: Pierre Dragicevic. Category: Physical model  Tags: economics, education, flows, hydraulic, liquid, physical computation, simulation, water


2006 – RoomQuake: Earthquake Visualization for the Classroom

Styrofoam balls hung from classroom ceiling representing the epicenters (location), magnitudes (diameter and color), and depths (length of the string) of a series of simulated earthquakes in a fifth grade classroom. Source: Tom Moher (2006) Embedded Phenomena: Supporting Science Learning with Classroom-sized Distributed Simulations.

Added by: Pierre Dragicevic, sent by: Tom Moher. Category: Passive physical visualization  Tags: earthquake, education, hand-made, styrofoam, walkable


2008 – Kids Reconstruct Harry Potter's Social Network

At the 2008 science fair (fête de la science), the Aviz group had kids build physical node-link diagrams of Harry Potter's social network using magnets and rubber bands. Source: Aviz. http://www.aviz.fr/old/fetedelascience08/

Added by: Pierre Dragicevic. Category: Passive physical visualization  Tags: education, hand-built, network, participatory, rearrangeable


2010 – Data Sculptures in Class

The two data sculptures above have been created by undergraduate students as part of a design class given by Andrew Vande Moere at the University of Sydney. A 2010 article he coauthored with Stephanie Patel (link below) provides many other examples of these. Andrew Vande Moere has published several articles on data sculptures since 2008. Sources: Andrew Vande Moere and Stephanie Patel (2010) The Physical Visualization of Information: Designing Data Sculptures in an Educational Context. Also see […]

Added by: Pierre Dragicevic. Category: Passive physical visualization  Tags: data sculptures, education


2021 – Personal Data Physicalizations in Class

      Images created by students to represent their personal data. Refer to the publication below for image attributions. I describe the results of implementing a personal data physicalization assignment in an information visualization course for senior undergraduate and graduate students in computer science and software engineering. By collecting data about themselves and representing this data in physical forms, students were able to i) learn about data visualization, ii) […]

Added by: Charles Perin. Category: Passive physical visualization  Tags: teaching, personal data, physicalization, education