Tag: rearrangeable

5500 BC – Mesopotamian Clay Tokens

The earliest data visualizations were likely physical: built by arranging stones or pebbles, and later, clay tokens. According to an eminent archaeologist (Schmandt-Besserat, 1999): "Whereas words consist of immaterial sounds, the tokens were concrete, solid, tangible artifacts, which could be handled, arranged and rearranged at will. For instance, the tokens could be ordered in special columns according to types of merchandise, entries and expenditures; donors or recipients. The token system […]

Added by: Pierre Dragicevic. Category: Passive physical visualization  Tags: anthropology, archaeology, clay, mesopotamians, rearrangeable


1820 – Papier-Mâché Anatomical Models

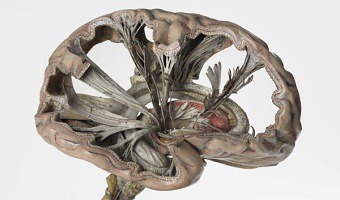
Left image: As part of its 2014 exhibition entitled Mind Maps: Stories from Psychology, the London Science Museum showcased this very accurate and intricate papier-mâché brain model from 1900 that shows path of nerve fibers. French physician Louis Thomas Jerôme Auzoux developed this technique around 1820 due to the shortage of human cadavers and wax models to study human anatomy. He was inspired by papier-mâché dolls that were common at the time. His models became popular in schools, […]

Added by: Pierre Dragicevic, sent by: Tobias Isenberg. Category: Physical model  Tags: anatomy, hand-made, model, papier-mâché, rearrangeable, science


1901 – Davenport's Physical Distributions

In 1901, biologist Charles Davenport "built" physical visualizations that show the distributions of features of objects and people. These visualizations were made out of the objects and the people themselves. The purpose was to explain the notion of statistical distribution to a lay audience. On the left image, seashells are piled up according to how many ribs they have. On the middle image, students are arranged in bins according to their height. On the right image, they are simply sorted. […]


1926 – Karsten's Tridimensional Chart

American economist and statistician Karl G. Karsten patented a method for creating physical visualizations of temporal data by stacking two-dimensional plates, each representing a time period. Each of the plates shown above is a variable-width column chart representing the state of the stock market at the end of a particular month. Each bar is a type of stock, where the height of the bar encodes the stock price and its width encodes volumes of sales. Each month, a new layer is added. Seen from […]

Added by: Pierre Dragicevic, sent by: RJ Andrews. Category: Passive physical visualization  Tags: rearrangeable, stock market, temporal data


1968 – Jacques Bertin's Reorderable Matrices

The reorderable matrix is a physical device developed in the mid 1960s by French cartographer Jacques Bertin for exploring and presenting tabular data. Bertin designed several reorderable physical matrices he called Dominos, each with a different size and visual encoding. The first three images above show a small, medium, and large version. A rod mechanism allowed unlocking either rows or columns for reordering. The dominos were part of a general method of “graphic information processing”, […]

Added by: Pierre Dragicevic. Category: Passive physical visualization  Tags: Bertin, rearrangeable, reorderable matrix


1995 – San Diego TeleManufacturing Facility

In 1995, Mike Bailey from the San Diego Supercomputer Center created the SDSC TeleManufacturing Facility to help scientists visualize their data in physical form. In 1997, the facility produced one of the first digitally-fabricated molecular models using laminated object manufacturing. The biochemists involved in the project got insights that they were not able to get from the on-screen 3D models, and concluded that: modern physical models are important tools that significantly extend the […]


2004 – Scripps' Molecule Models

Since 2004 the Molecular Graphics Laboratory at the Scripps Research Institute has been making heavy use of 3D-printed full-color physical molecule models, some of which are articulated (left image), flexible (middle image), and even self-assembling (right image, see video). They also publish augmented reality systems that use those physical models. Also see our entry 1995 – SDSC TeleManufacturing Facility. Sources: Web Page: http://mgl.scripps.edu/projects/tangible_models Tommy Toy (2011) How […]


2005 – Tactile Rubik’s Cubes

An online article compares several different designs for tactile Rubik's Cubes created between 2005 and 2010. Left image: different objects on the outside of the cube give each side a different feel. Right image: laser-cut shapes. Source: Smithsonian magazine.

Added by: Yvonne Jansen, sent by: Fanny Chevalier. Category: Other  Tags: laser-cut, rearrangeable, tactile


2008 – Activity Logging with LEGO Bricks

A visualization and logging method for personal work activity. Every tower is a day of the week. A layer is one working hour, horizontally subdivided in four quarters of an hour. Different colors are different projects. The constant availability of this interface makes it easier to log personal activity data on-the-fly, before entering it in a PIM software (an automatic method involving computer vision is being considered). Source: Michael Hunger (2008) On LEGO Powered Time-Tracking. Blog post. […]


2008 – Rearrangeable Wooden Model of Brain Scan

A selection of MRI data glued on 60 wooden blocks which allow to physically dig into cross sections, by Neil Fraser. More details on infosthetics. Source: infosthetics.com.

Added by: Yvonne Jansen. Category: Passive physical visualization  Tags: brain, dynamic, rearrangeable, science


2008 – Kids Reconstruct Harry Potter's Social Network

At the 2008 science fair (fête de la science), the Aviz group had kids build physical node-link diagrams of Harry Potter's social network using magnets and rubber bands. Source: Aviz. http://www.aviz.fr/old/fetedelascience08/

Added by: Pierre Dragicevic. Category: Passive physical visualization  Tags: education, hand-built, network, participatory, rearrangeable


2010 – Hans Rosling Adopts Physical Visualizations

Hans Rosling is famous worldwide for his fascinating speeches about population growth and income inequalities, notably his 2006 TED Talk where he debunks myths about the third world using animated charts. In 2010 he started to tell stories about data using physical visualizations. He started by stacking Ikea boxes, then switched to a variety familiar objects including pebbles, toy construction kits, fruit juice, snow balls and even toilet paper. Hans' son Ola Rosling is behind the technology […]

Added by: Pierre Dragicevic & Yvonne Jansen. Category: Passive physical visualization  Tags: LEGO, rearrangeable, storytelling, TED


2012 – Bit Planner - LEGO calendar

Vitamins studio created The Bit Planner, an elegant wall mounted time and resource planner made entirely of Lego bricks. In this tangible calendar, each gray row represents a month, and each gray rectangle represents a week, and everyone in the group has their own line in the calendar (see left image). Projects are associated to different colors, and each LEGO block corresponds to half a day spent working on a project. While entirely tangible, the Bit Planner can be synched with an online, […]


2012 – Rearrangeable 3D Bar Chart

A modular physical visualization like this rearrangeable 3D bar chart allows people to sort, filter, compare and examine data by direct physical manipulation. Sources: Yvonne Jansen and Pierre Dragicevic (2013) An Interaction Model for Visualizations Beyond the Desktop. Also see Yvonne Jansen's PhD dissertation on Physical and Tangible Information Visualization (2014)

Added by: Pierre Dragicevic. Category: Passive physical visualization  Tags: bar chart, rearrangeable


2012 – Thesis LEGO Board

A design exploration of LEGO-based physical visualizations for project management by educational scientist Daniel K. Schneider. Sources: Daniel K. Schneider (2012) Lego-compatible thesis project board. Edutech Wiki. Daniel K. Schneider (2015) Poster presentation from the EIAH'15 conference (the paper, the actual poster)

Added by: Pierre Dragicevic. Category: Passive physical visualization  Tags: LEGO, manual update, project management, rearrangeable


2012 – General Motors' 3D LEGO Visualizations

LEGOs help business executives log and explore data. Sources: Mark Wilson (2012) How GM Is Saving Cash Using Legos As A Data Viz Tool. The Daily Drive (2012) GM Plays with Legos (Video).

Added by: Pierre Dragicevic, sent by: Fanny Chevalier. Category: Passive physical visualization  Tags: industry, interactive, LEGO, manual update, pragmatic visualization, rearrangeable


2013 – Layered 2D Plots

A series of stacked 2D plots showing changes in energy sources for different countries by PhD student Simon Stusak from University of Munich. All plots are cut from acrylic and hold together in one corner to facilitate alignment of the layers. The y-axis is mapped to countries, the x-axis to different energy sources, and the z-axis to time. Sources: Simon Stusak (2013) Physical Visualizations: An Exploration. Simon Stusak, Aurélien Tabard and Andreas Butz (2013) Can Physical Visualizations […]

Added by: Yvonne Jansen, sent by: Pierre Dragicevic. Category: Passive physical visualization  Tags: lasercut, rearrangeable, stacked 2D


2014 – Rearrangeable Display of Ice Data

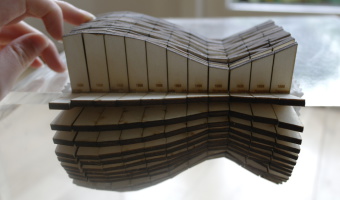
This 3d data visualization, created by Johannes Jacubasch and Judith Weda, shows sea ice levels from 1979 to 2012. The years are plotted on one axis and the months on the other axis, while the height of the wooden pieces shows the level of sea ice. This data visualization can be opened up at any year or month to view the data from up close. If you break the Y-axis it shows all the data from a particular year. If the X-axis is broken it shows ice levels of a particular month over all the years. […]


2014 – Data Storytelling with LEGOs

   LEGO blocks are convenient tools to progressively construct a physical visualization while unfolding a story. In the same vein as Hans Rosling's educational stories on data, Brookings fellows use LEGO bricks to explain societal concerns such as how much the U.S. tax system helps shrink the gap between extreme social classes1 and the chances for economic success of Americans born at the bottom of the economic ladder 2. Sources: […]

Added by: Fanny Chevalier. Category: Passive physical visualization  Tags: LEGO, rearrangeable, storytelling


2014 – DIY Bertin Matrix

This wooden matrix is a large-scale replica of Jacques Bertin's reorderable physical matrices. It shows a subset of the World Value Survey, a series of questionnaires that assess people's moral values across countries and years. This physical visualization is interactive as row and columns can be manipulated, promoting engagement and collaboration. This 18x20 matrix was built by Mathieu Le Goc in the Fablab Digscope with Charles Perin and Romain Di Vozzo, on the occasion of the 25th birthday of […]


2014 – Building Visualizations with Tokens

Samuel Huron and his collaborators show how anyone can build their own visualizations by assembling physical tokens. Sources: Samuel Huron, Sheelagh Carpendale, Alice Thudt, Anthony Tang, Michael Mauerer (2014) Constructive Visualization (Web Page) Samuel Huron, Yvonne Jansen and Sheelagh Carpendale (2014) Constructing Visual Representations: Investigating the Use of Tangible Tokens (Web page)


2015 – Rearrangeable Physical Map

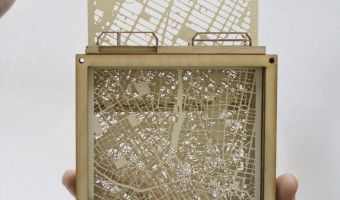
Andrew Chard, an award-winning graduate student in architecture at Oxford Brookes, created this multi-layered wooden map where layers can be individually pulled out and rearranged. According to the object's legend, this map shows different cities on top of each other so that people can compare their structure. There is not much information available online but Andrew explained to us by e-mail: It was so long ago that I wouldn’t be able to remember the scale or locations I am afraid. Apart from […]

Added by: Pierre Dragicevic, sent by: Carmen Hull. Category: Physical model  Tags: cartographic, laser-cut, rearrangeable


2016 – Cairn: Situated Data Collection and Analysis for Fab Labs

Designed within the community of practice of a French FabLab, Cairn aims at understanding the variety of practices within FabLabs. Cairn explores tangible alternatives to questionnaires and other traditional evaluation techniques, and stresses aesthetic and affective dimensions to create an engaging experience. It invites Fablab visitors to reflect on their practices by materializing their activities using small colored woodentiles. Interacting individually with Cairn, people contribute to […]

Added by: Pauline Gourlet. Category: Passive physical visualization  Tags: collecting tool, fab lab, participatory, rearrangeable


2017 – Fabricating Physical Globe Visualizations

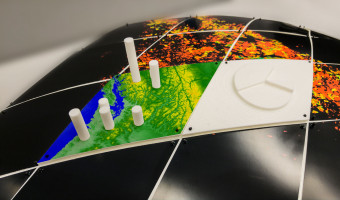
Geospatial datasets are too complex to easily visualize and understand on a computer screen. Combining digital fabrication with a discrete global grid system (DGGS) can produce physical models of the Earth for visualizing multiresolution geospatial datasets. This proposed approach includes a mechanism for attaching a set of 3D printed segments to produce a scalable model of the Earth. Two models have been produced that support the attachment of different datasets both in 2D and 3D format. Also […]

Added by: Hessam Djavaherpour. Category: Enabling technology  Tags: 3d printing, cartographic, digital fabrication, globe, rearrangeable


2018 – Steven Pinker explains Global Life Expectancy with Physical Line Charts

Bill Gates shared a short video featuring Steven Pinker on his Twitter feed with the comment People today are living longer, healthier, and happier lives than ever before. I asked @sapinker to explain why. At first glance it appears that line charts are digitally overlaid on the video. However, closeups and a light swaying of the graphs when Steven Pinker touches them, as well as the addition of another country towards the end of the video indicate that the graphs visible in this video are […]

Added by: Yvonne Jansen, sent by: Cedric Honnet. Category: Passive physical visualization  Tags: rearrangeable, storytelling