American artist Cory Imig reconstructed the layout of the city of Savannah using LEGO bricks, and over the course of one month she added a colored brick every time she went to a particular place. Each color is a different day of the week. Source: Cory Imig (2008) Psychogeographical Mapping (see the section Documenting of her Web page for more data sculptures).
2008 – Bug Tracking with LEGO Bricks
Takeshi Kakeda explains how to use LEGO bricks for bug tracking. Source: Takeshi Kakeda (2008) Tangible Bug Tracking using LEGO bricks. Agile 2008 conference.
2008 – Activity Logging with LEGO Bricks
A visualization and logging method for personal work activity. Every tower is a day of the week. A layer is one working hour, horizontally subdivided in four quarters of an hour. Different colors are different projects. The constant availability of this interface makes it easier to log personal activity data on-the-fly, before entering it in a PIM software (an automatic method involving computer vision is being considered). Source: Michael Hunger (2008) On LEGO Powered Time-Tracking. Blog post. […]
2010 – Hans Rosling Adopts Physical Visualizations
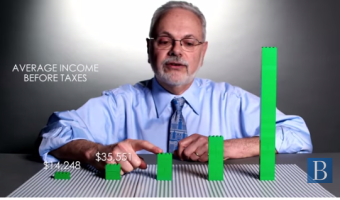
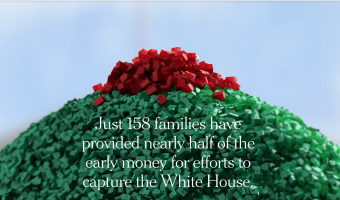
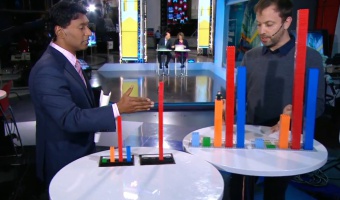
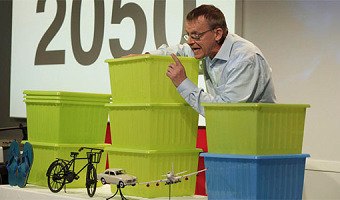
Hans Rosling is famous worldwide for his fascinating speeches about population growth and income inequalities, notably his 2006 TED Talk where he debunks myths about the third world using animated charts. In 2010 he started to tell stories about data using physical visualizations. He started by stacking Ikea boxes, then switched to a variety familiar objects including pebbles, toy construction kits, fruit juice, snow balls and even toilet paper. Hans' son Ola Rosling is behind the technology […]
2011 – LEGO Prism Maps
Prism maps showing migration patterns between the Americas. Each Lego brick represents 10.000 people. Source: Samuel Granados. Lego Cartograms (via FlowingData and infosthetics).
2012 – Bit Planner - LEGO calendar
Vitamins studio created The Bit Planner, an elegant wall mounted time and resource planner made entirely of Lego bricks. In this tangible calendar, each gray row represents a month, and each gray rectangle represents a week, and everyone in the group has their own line in the calendar (see left image). Projects are associated to different colors, and each LEGO block corresponds to half a day spent working on a project. While entirely tangible, the Bit Planner can be synched with an online, […]
2012 – Poland Budget Presented with LEGO Bricks
An area chart created with LEGO bricks. Each colour presents a single domain in the 2011 Polish budget. Source: Przemyslaw Biecek (2012) SmarterPoland.
2012 – Thesis LEGO Board
A design exploration of LEGO-based physical visualizations for project management by educational scientist Daniel K. Schneider. Sources: Daniel K. Schneider (2012) Lego-compatible thesis project board. Edutech Wiki. Daniel K. Schneider (2015) Poster presentation from the EIAH'15 conference (the paper, the actual poster)
2012 – General Motors' 3D LEGO Visualizations
LEGOs help business executives log and explore data. Sources: Mark Wilson (2012) How GM Is Saving Cash Using Legos As A Data Viz Tool. The Daily Drive (2012) GM Plays with Legos (Video).
2014 – Lego Senate
Built by Lance Ulanoff, this Lego representation tells the story of the 2014 US midterms. Red and blue Lego blocks represent the number of Democrat and Republican senate seats. The representation was updated over the evening of the election, as seats went to either Democratic or Republican candidates. Captions tell the story, indicating the time of seat wins and the names of senators. Source: Mashable, The Lego Senate: How the 2014 midterms played out, brick by brick
2014 – Data Storytelling with LEGOs
LEGO blocks are convenient tools to progressively construct a physical visualization while unfolding a story. In the same vein as Hans Rosling's educational stories on data, Brookings fellows use LEGO bricks to explain societal concerns such as how much the U.S. tax system helps shrink the gap between extreme social classes1 and the chances for economic success of Americans born at the bottom of the economic ladder 2. Sources: […]
2015 – U.S. Cost of Political Campaigns
The New York Times has used stacks of Monopoly plastic hotels to explain what the cost of the U.S. political campains means in terms of households. Though closer to concrete scales than it is to data visualization (that usually presents data in a more structured manner), this representation made of physical pieces from the famous board game makes the message particularly compelling. According to the New York Times, Just 158 families have provided nearly half of the early money for efforts to […]
2015 – Canadian Federal Election Explained with LEGOs
On Canadian national news, Toronto-based artist and organiser Dave Meslin used LEGO bricks to illustrate the results of the 2015 federal election. He shows election results based on a first-past-the-post system, and compares them to a representation illustrating what results would look like if based on proportional representation. Source: CBC News (2015) If Canada had proportional representation: Dave Meslin shows with Lego.
2018 – Inequality in Chile Represented with LEGO Bricks
Inequality in Chile represented with LEGO bricks. Made by Harry Lizama, a data scientist in the Ministry of the Environment of Chile. The surface represents the totality of the income. Each person represents a decile. In light green is decile 10. In green is decile 9. In dark green are deciles 7 and 8. In red are deciles 1 to 6. Also see our other entries featuring LEGO bricks. Sources: Harry Lizama, based on data from the Ministry of Social Development, CASEN 2017. Image taken from […]