Tag: prism map

2011 – DIY United States Electoral Vote Map

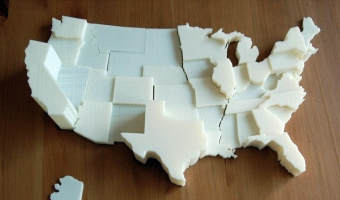
This is a 3D scale replica of the United States, the state height corresponds to the number of electoral votes each state controls in a presidential election. Source: thing 11178 on thingiverse.com


2011 – LEGO Prism Maps

Prism maps showing migration patterns between the Americas. Each Lego brick represents 10.000 people. Source: Samuel Granados. Lego Cartograms (via FlowingData and infosthetics).

Added by: Pierre Dragicevic. Category: Passive physical visualization  Tags: cartographic, LEGO, prism map


2016 – Actuated Prism Map of Italy

This actuated prism map was created by Alessandro Masserdotti in the OpenDot Fablab in Milan, Italy, for the SOD16 meeting and invites people explicitly to Touch That Data. OpenDot Fablab (Milan) project with Arduino and 3D printing visualizes regional statistics changing the height of each region. In the picture there's the building count from the regional extracts. Sources: Open streetmap wiki, 2016. Video from a demo at OSMIT 2016.

Added by: Yvonne Jansen, sent by: Jason Dykes. Category: Active physical visualization  Tags: 3d printing, cartographic, digital fabrication, prism map