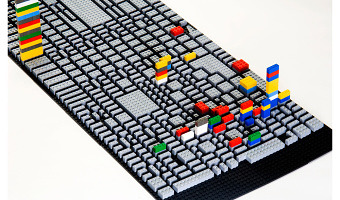
American artist Cory Imig reconstructed the layout of the city of Savannah using LEGO bricks, and over the course of one month she added a colored brick every time she went to a particular place. Each color is a different day of the week. Source: Cory Imig (2008) Psychogeographical Mapping (see the section Documenting of her Web page for more data sculptures).
American artist Cory Imig reconstructed the layout of the city of Savannah using LEGO bricks, and over the course of one month she added a colored brick every time she went to a particular place. Each color is a different day of the week. Source: Cory Imig (2008) Psychogeographical Mapping (see the section Documenting of her Web page for more data sculptures).
Added by: Pierre Dragicevic, sent by: Loren Madsen.
Category:
Passive physical visualization
Tags:
data sculpture, LEGO, self-logging, temporal data, travels