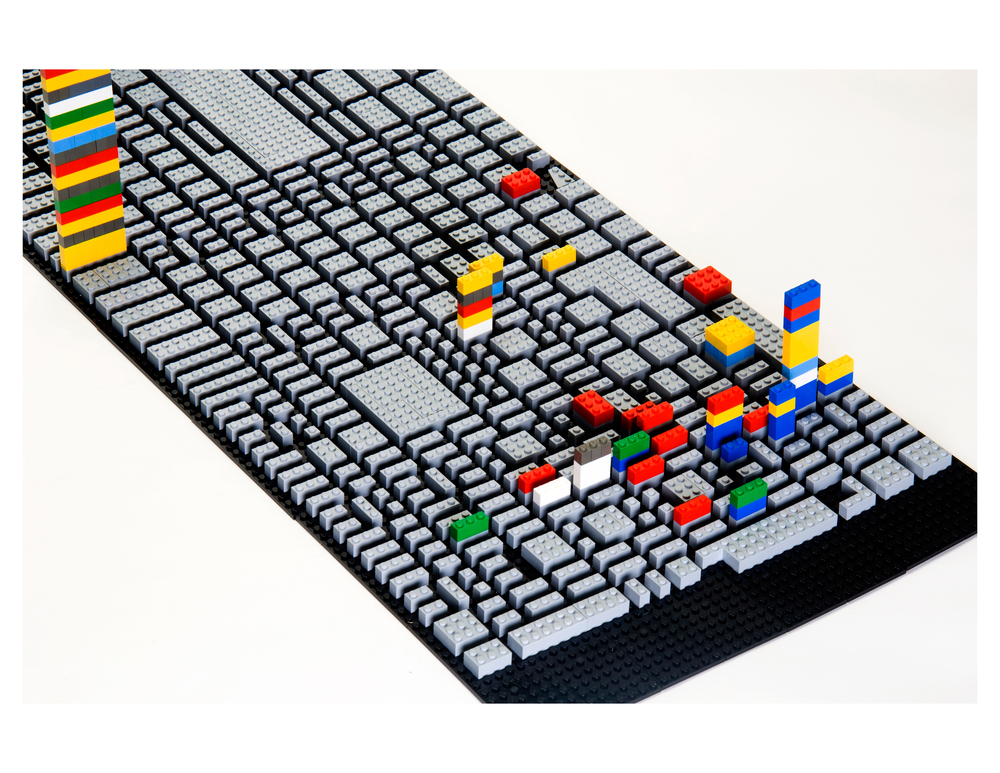
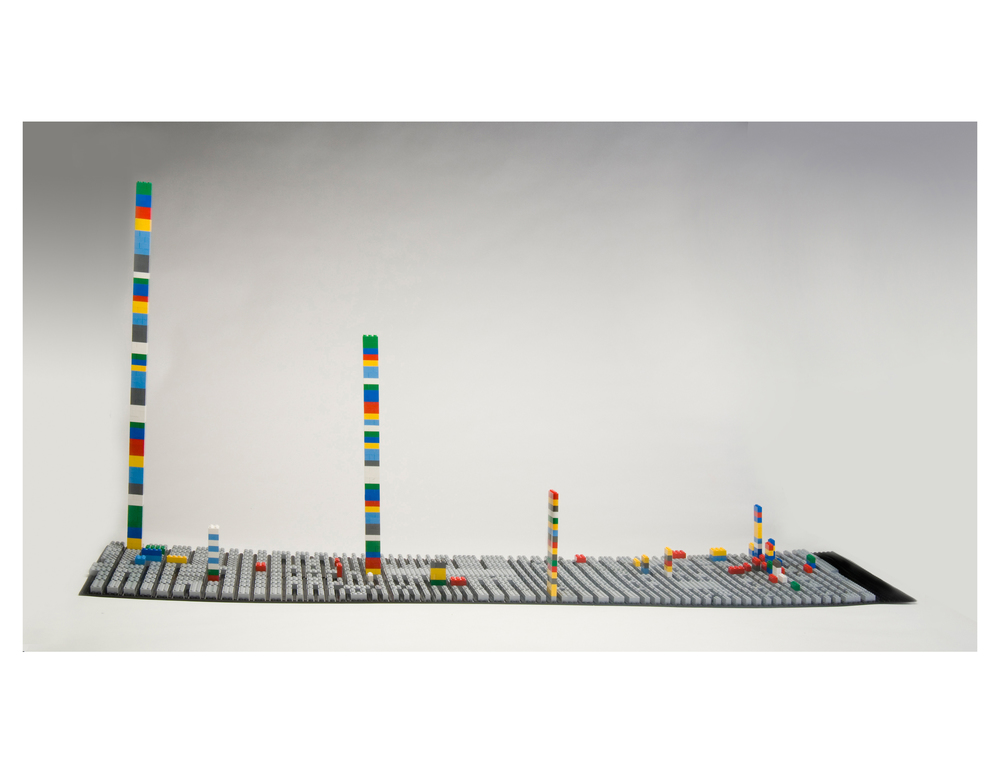
American artist Cory Imig reconstructed the layout of the city of Savannah using LEGO bricks, and over the course of one month she added a colored brick every time she went to a particular place. Each color is a different day of the week.
Source: Cory Imig (2008) Psychogeographical Mapping (see the section Documenting of her Web page for more data sculptures).
Added by: Pierre Dragicevic, sent by: Loren Madsen.
Category:
Passive physical visualization
Tags:
data sculpture, LEGO, self-logging, temporal data, travels