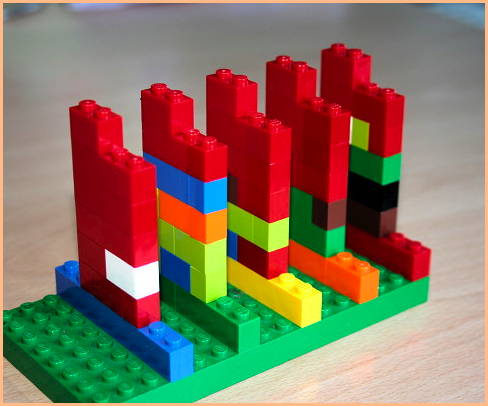
A visualization and logging method for personal work activity. Every tower is a day of the week. A layer is one working hour, horizontally subdivided in four quarters of an hour. Different colors are different projects. The constant availability of this interface makes it easier to log personal activity data on-the-fly, before entering it in a PIM software (an automatic method involving computer vision is being considered).
Source: Michael Hunger (2008) On LEGO Powered Time-Tracking. Blog post.
Added by: Pierre Dragicevic.
Category:
Passive physical visualization
Tags:
dynamic, LEGO, manual update, rearrangeable, self-logging, temporal data, time management