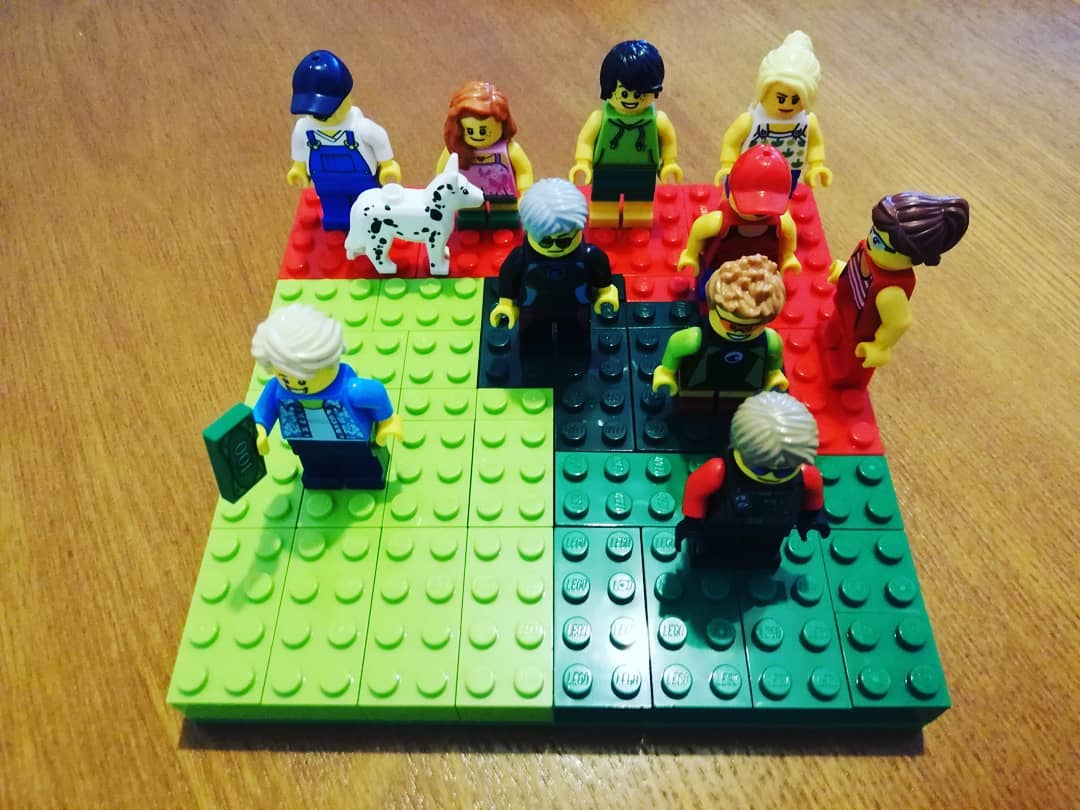
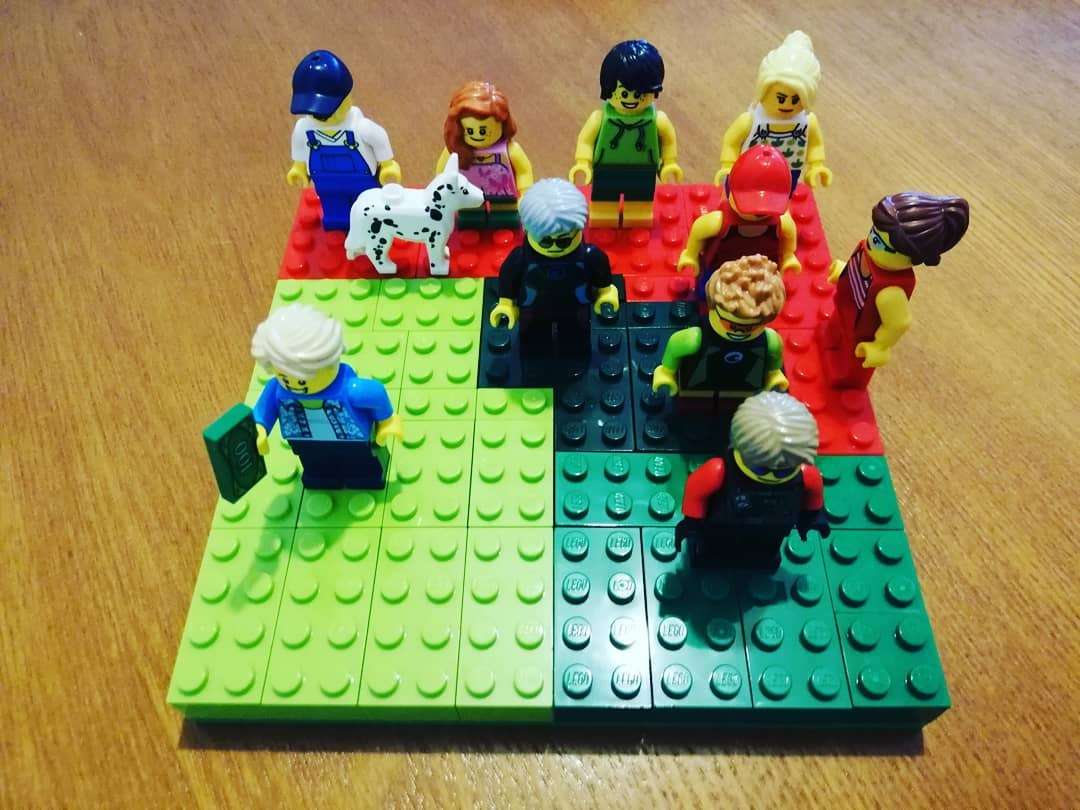
Inequality in Chile represented with LEGO bricks. Made by Harry Lizama, a data scientist in the Ministry of the Environment of Chile.
The surface represents the totality of the income. Each person represents a decile.
- In light green is decile 10.
- In green is decile 9.
- In dark green are deciles 7 and 8.
- In red are deciles 1 to 6.
Also see our other entries featuring LEGO bricks.
Sources:
- Harry Lizama, based on data from the Ministry of Social Development, CASEN 2017.
- Image taken from http://observatorio.ministeriodesarrollosocial.gob.cl/casen-multidimensional/casen/docs/Resultados_ingresos_Casen_2017.pdf
Added by: Harry Lizama.
Category:
Passive physical visualization
Tags:
Chile, income, inequality, LEGO