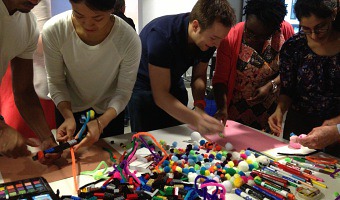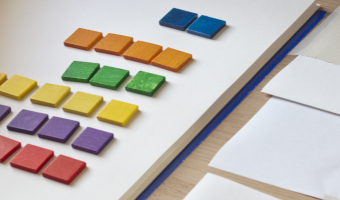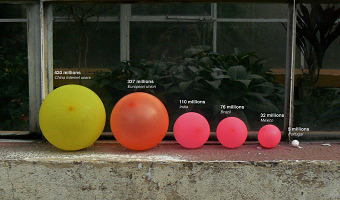
Colombian designer Jose Duarte wants to bring the DIY concept to data visualization. Using ordinary materials like balloons, tape and rubber balls, he has experimented with various visualization techniques from area charts to bubble graphs and ven diagrams in diverse scenarios as business, art, street interventions and even astronomy. To help people build physical visualizations he designed a physical toolkit he calls the Handmade visualization toolkit. Sources: Maria Popova (2011) Analog […]
Colombian designer Jose Duarte wants to bring the DIY concept to data visualization. Using ordinary materials like balloons, tape and rubber balls, he has experimented with various visualization techniques from area charts to bubble graphs and ven diagrams in diverse scenarios as business, art, street interventions and even astronomy. To help people build physical visualizations he designed a physical toolkit he calls the Handmade visualization toolkit. Sources: Maria Popova (2011) Analog Infoviz: Handmade Visualization Toolkit. Jose Duarte's Flickr photostream. Jose Duarte's Website www.handmadevisuals.com. All images by Jose Duarte.
Added by: Pierre Dragicevic.
Category:
Passive physical visualization
Tags:
authoring, charts, hand-made, toolkit