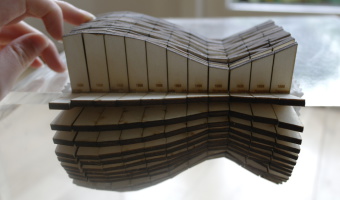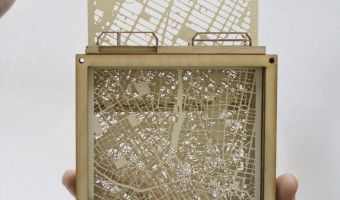
Andrew Chard, an award-winning graduate student in architecture at Oxford Brookes, created this multi-layered wooden map where layers can be individually pulled out and rearranged. According to the object's legend, this map shows different cities on top of each other so that people can compare their structure. There is not much information available online but Andrew explained to us by e-mail: It was so long ago that I wouldn’t be able to remember the scale or locations I am afraid. Apart from […]
Andrew Chard, an award-winning graduate student in architecture at Oxford Brookes, created this multi-layered wooden map where layers can be individually pulled out and rearranged. According to the object's legend, this map shows different cities on top of each other so that people can compare their structure. There is not much information available online but Andrew explained to us by e-mail: It was so long ago that I wouldn’t be able to remember the scale or locations I am afraid. Apart from the fact that the model was based on Piraeus in Greece. I called it the Rotary model. It was a collection of research undertaken to understand an architectural site, before actually visiting it. Each segment could be rotated to view each piece individually. This segment was used to understand the scale of the site by comparison, by sliding each map, known locations can be compared to the unknown, allowing a simple understanding of its spatial makeup. Sources: Andrew Chard (2015) Year 3/ Semester 1/ Rotary model. Images by Andrew Chard.