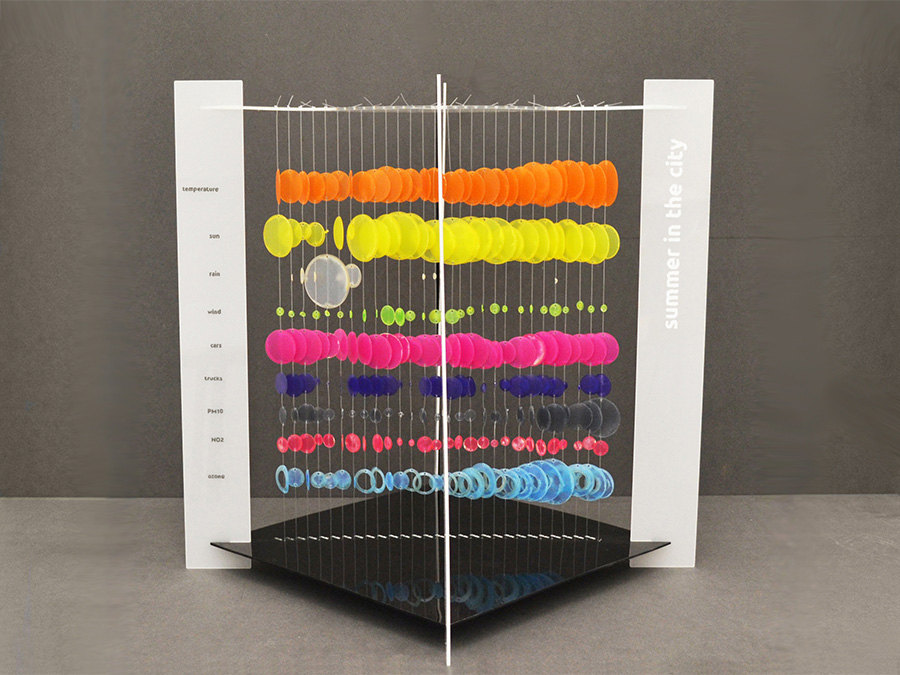
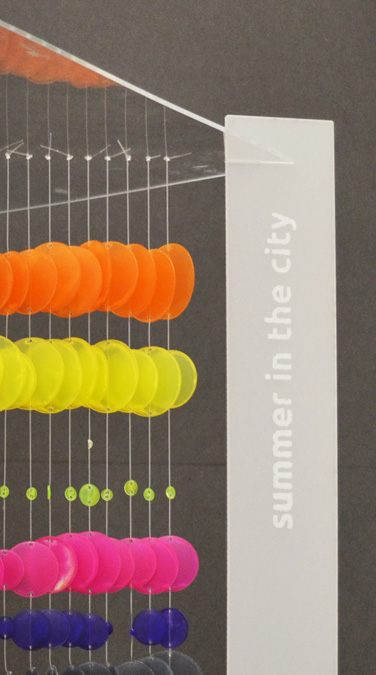
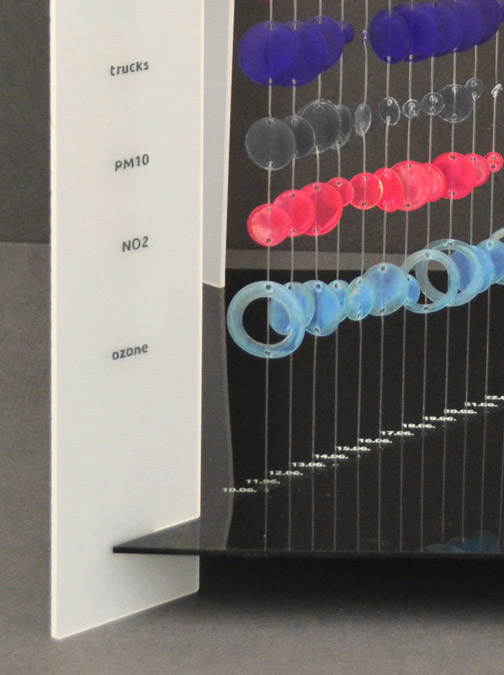
The visualization explores the direct influence of weather and traffic volume on air pollution, comparing data of a 4-week period during summer 2015 in Lugano (Switzerland). Different colored laser cut plates fixed on wires represent daily data. As the wires are diagonally mounted on the structure, looking from different sides, they evidence either daily data or the evolution of the parameters.
Source: Carola Bartsch (2015), Summer in the city
Added by: Carola Bartsch.
Category:
Passive physical visualization
Tags:
air pollution, data sculpture, digital fabrication, environment, laser-cut, traffic, weather