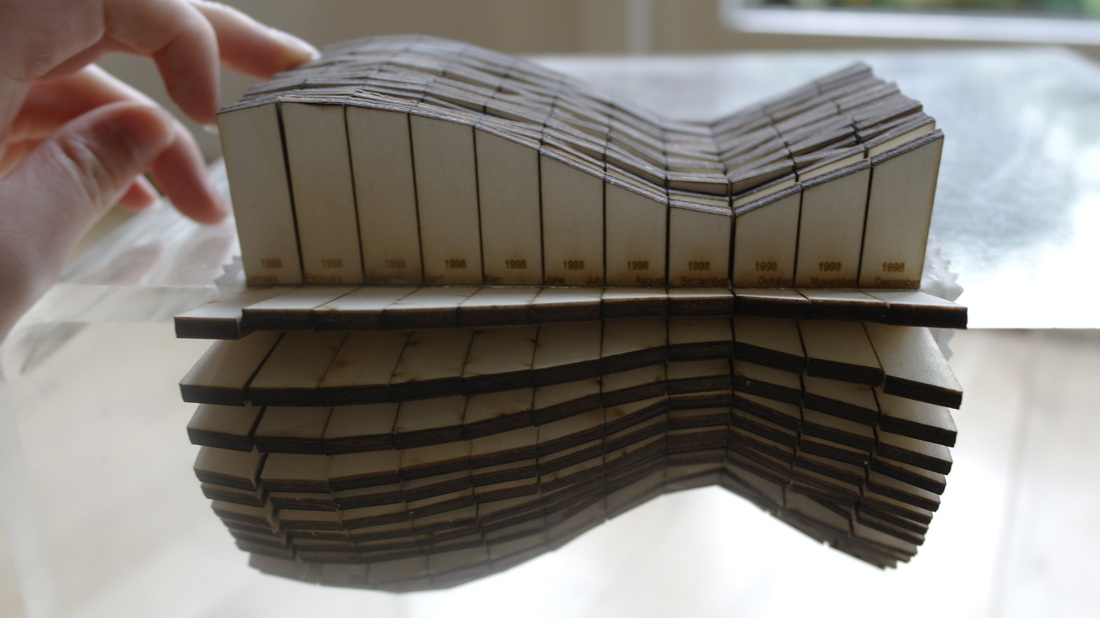
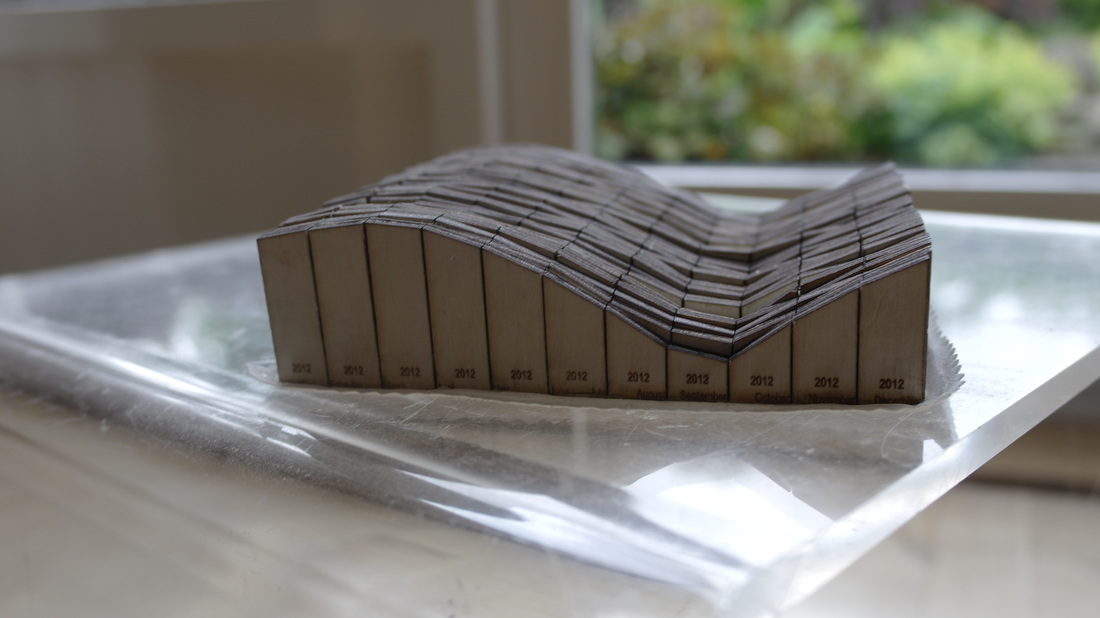


This 3d data visualization, created by Johannes Jacubasch and Judith Weda, shows sea ice levels from 1979 to 2012. The years are plotted on one axis and the months on the other axis, while the height of the wooden pieces shows the level of sea ice. This data visualization can be opened up at any year or month to view the data from up close. If you break the Y-axis it shows all the data from a particular year. If the X-axis is broken it shows ice levels of a particular month over all the years. The visualization exists out of 384 separate laser cut pieces of wood mounted on a piece of cloth, which makes it possible to fold or break the visualization to view all the data.
Sources:
Added by: Judith Weda.
Category:
Passive physical visualization
Tags:
digital fabrication, ice data, laser-cut, rearrangeable, weather, wooden