American economist and statistician Karl G. Karsten patented a method for creating physical visualizations of temporal data by stacking two-dimensional plates, each representing a time period. Each of the plates shown above is a variable-width column chart representing the state of the stock market at the end of a particular month. Each bar is a type of stock, where the height of the bar encodes the stock price and its width encodes volumes of sales. Each month, a new layer is added. Seen from […]
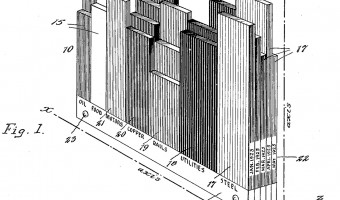
American economist and statistician Karl G. Karsten patented a method for creating physical visualizations of temporal data by stacking two-dimensional plates, each representing a time period. Each of the plates shown above is a variable-width column chart representing the state of the stock market at the end of a particular month. Each bar is a type of stock, where the height of the bar encodes the stock price and its width encodes volumes of sales. Each month, a new layer is added. Seen from above, this 3D visualization becomes a 2D stacked bar chart showing volumes of sales across time. Karl G. Karsten wrote a book entitled Charts And Graphs in 1925, where he discusses physical visualizations used in engineering. Many of these were previously discussed in John Peddle's 1910 book The construction of graphical charts and Willard Cope Brinton's 1914 book Graphic Methods for Presenting Facts. Also see our entries 1935 – 3D Visualizations of Power Consumption and 1951 – Electricity Generated or Demanded. Source: Karl G. Karsten (1926) Tridimensional Chart. US Patent.
Added by: Pierre Dragicevic, sent by: RJ Andrews.
Category:
Passive physical visualization
Tags:
rearrangeable, stock market, temporal data