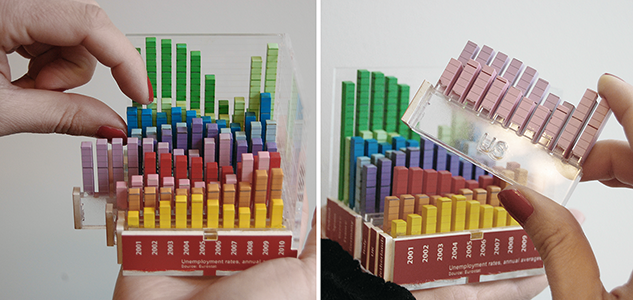
A modular physical visualization like this rearrangeable 3D bar chart allows people to sort, filter, compare and examine data by direct physical manipulation.
Sources:
- Yvonne Jansen and Pierre Dragicevic (2013) An Interaction Model for Visualizations Beyond the Desktop.
- Also see Yvonne Jansen's PhD dissertation on Physical and Tangible Information Visualization (2014)
Added by: Pierre Dragicevic.
Category:
Passive physical visualization
Tags:
bar chart, rearrangeable