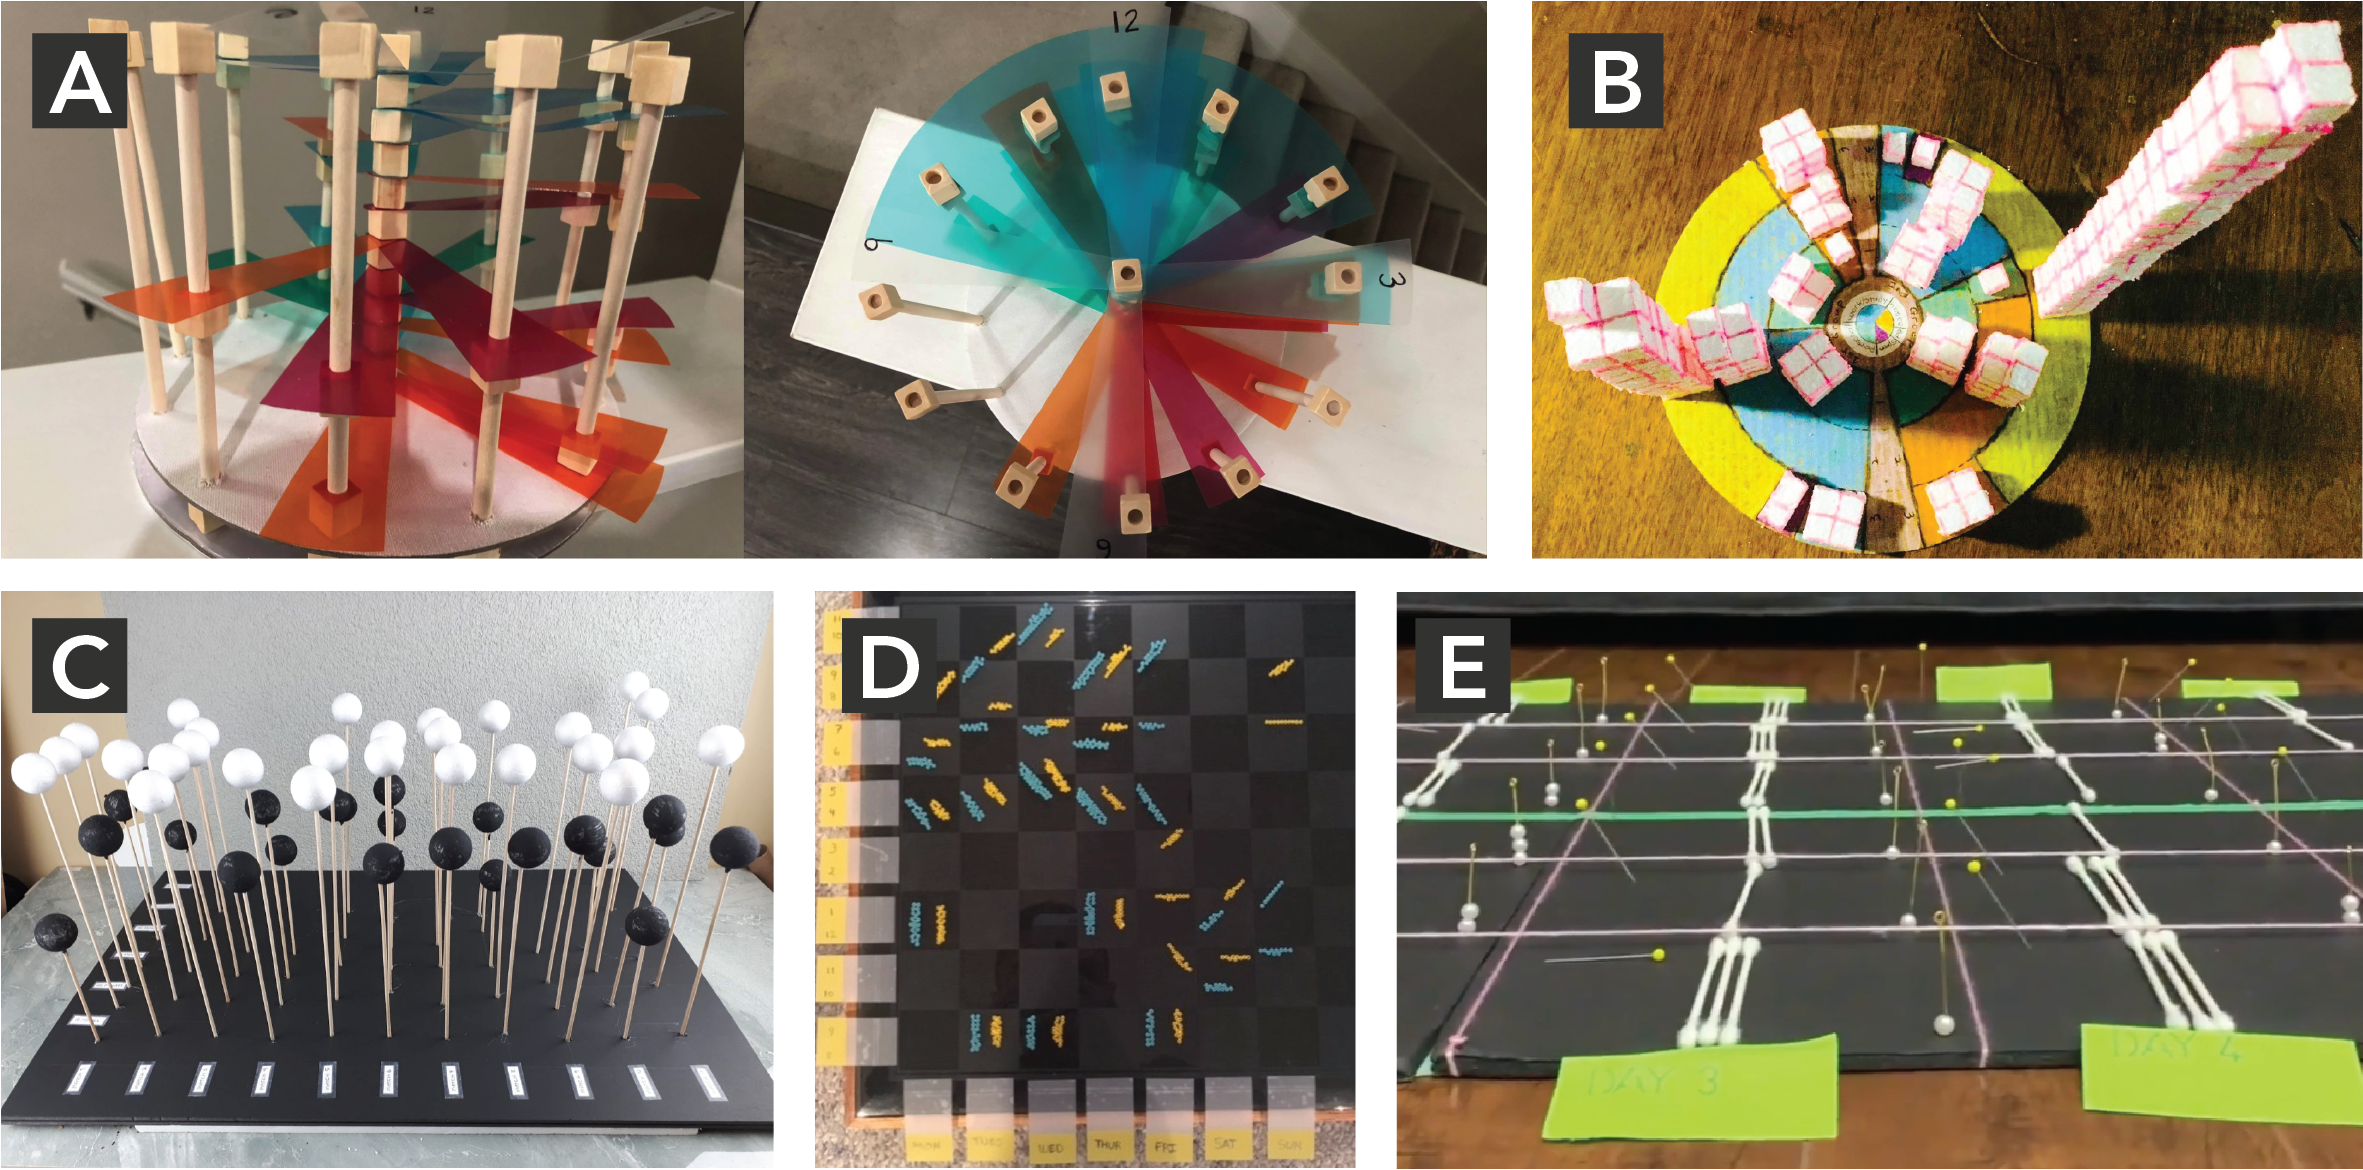

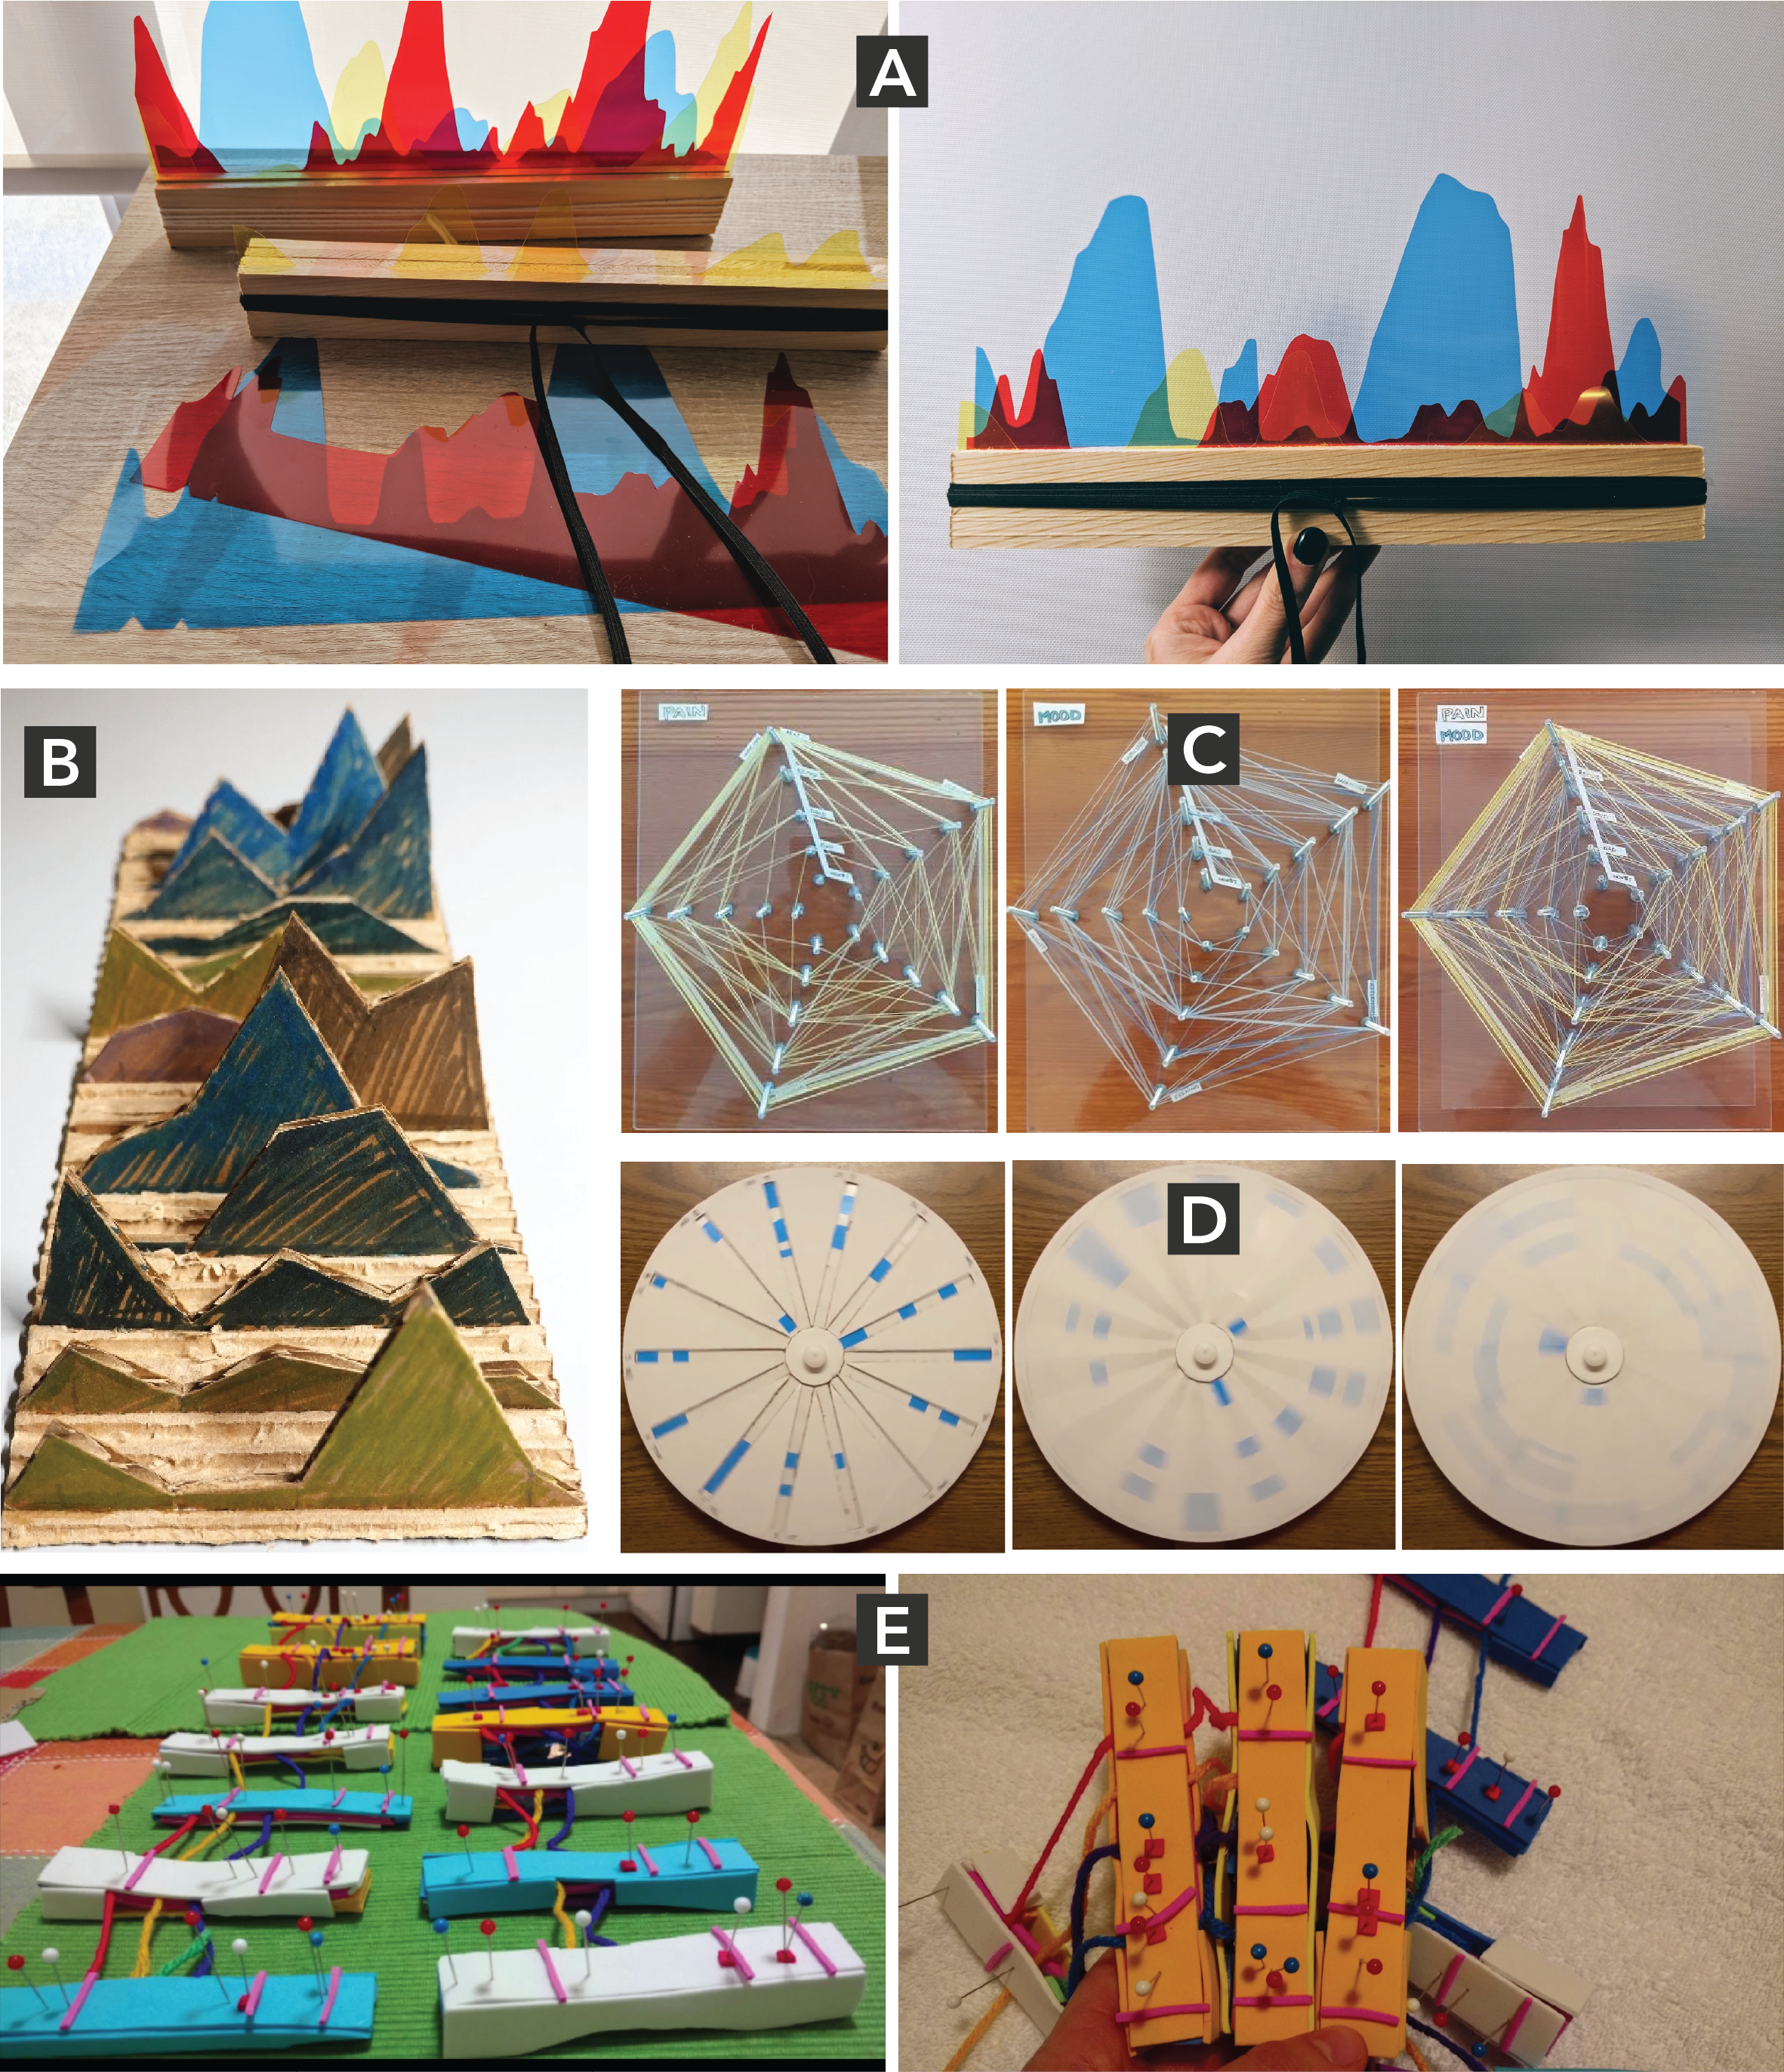
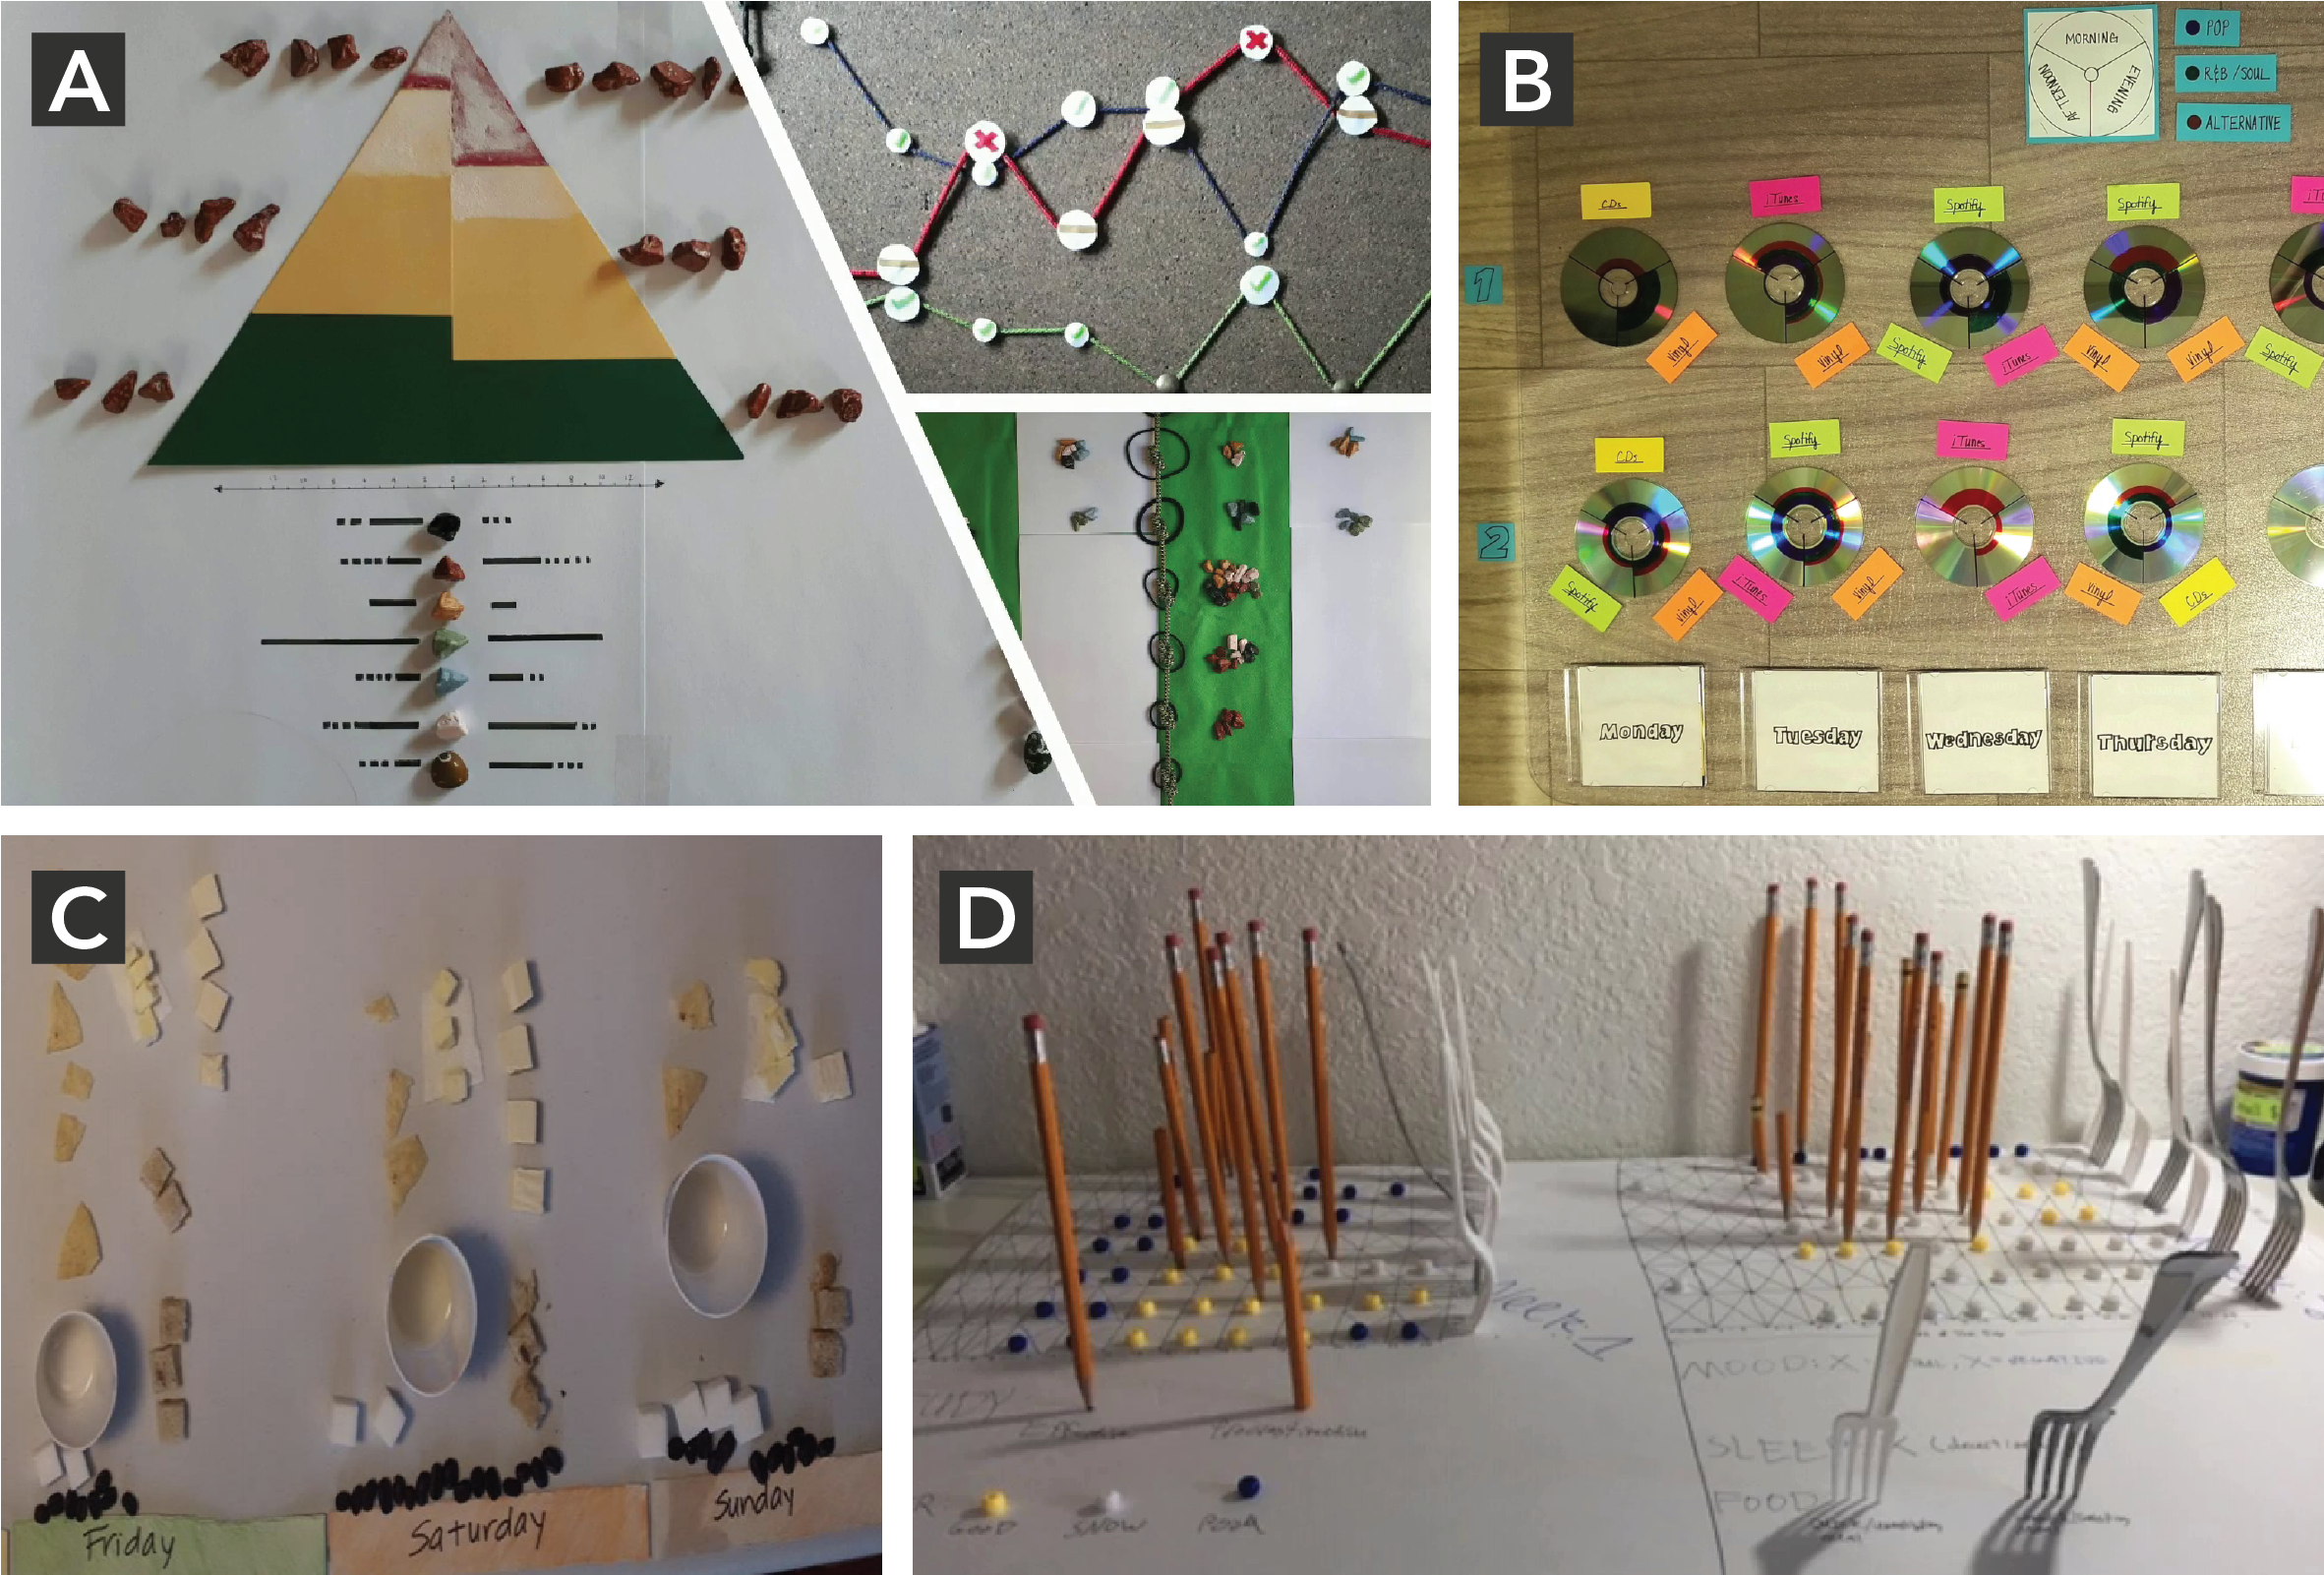
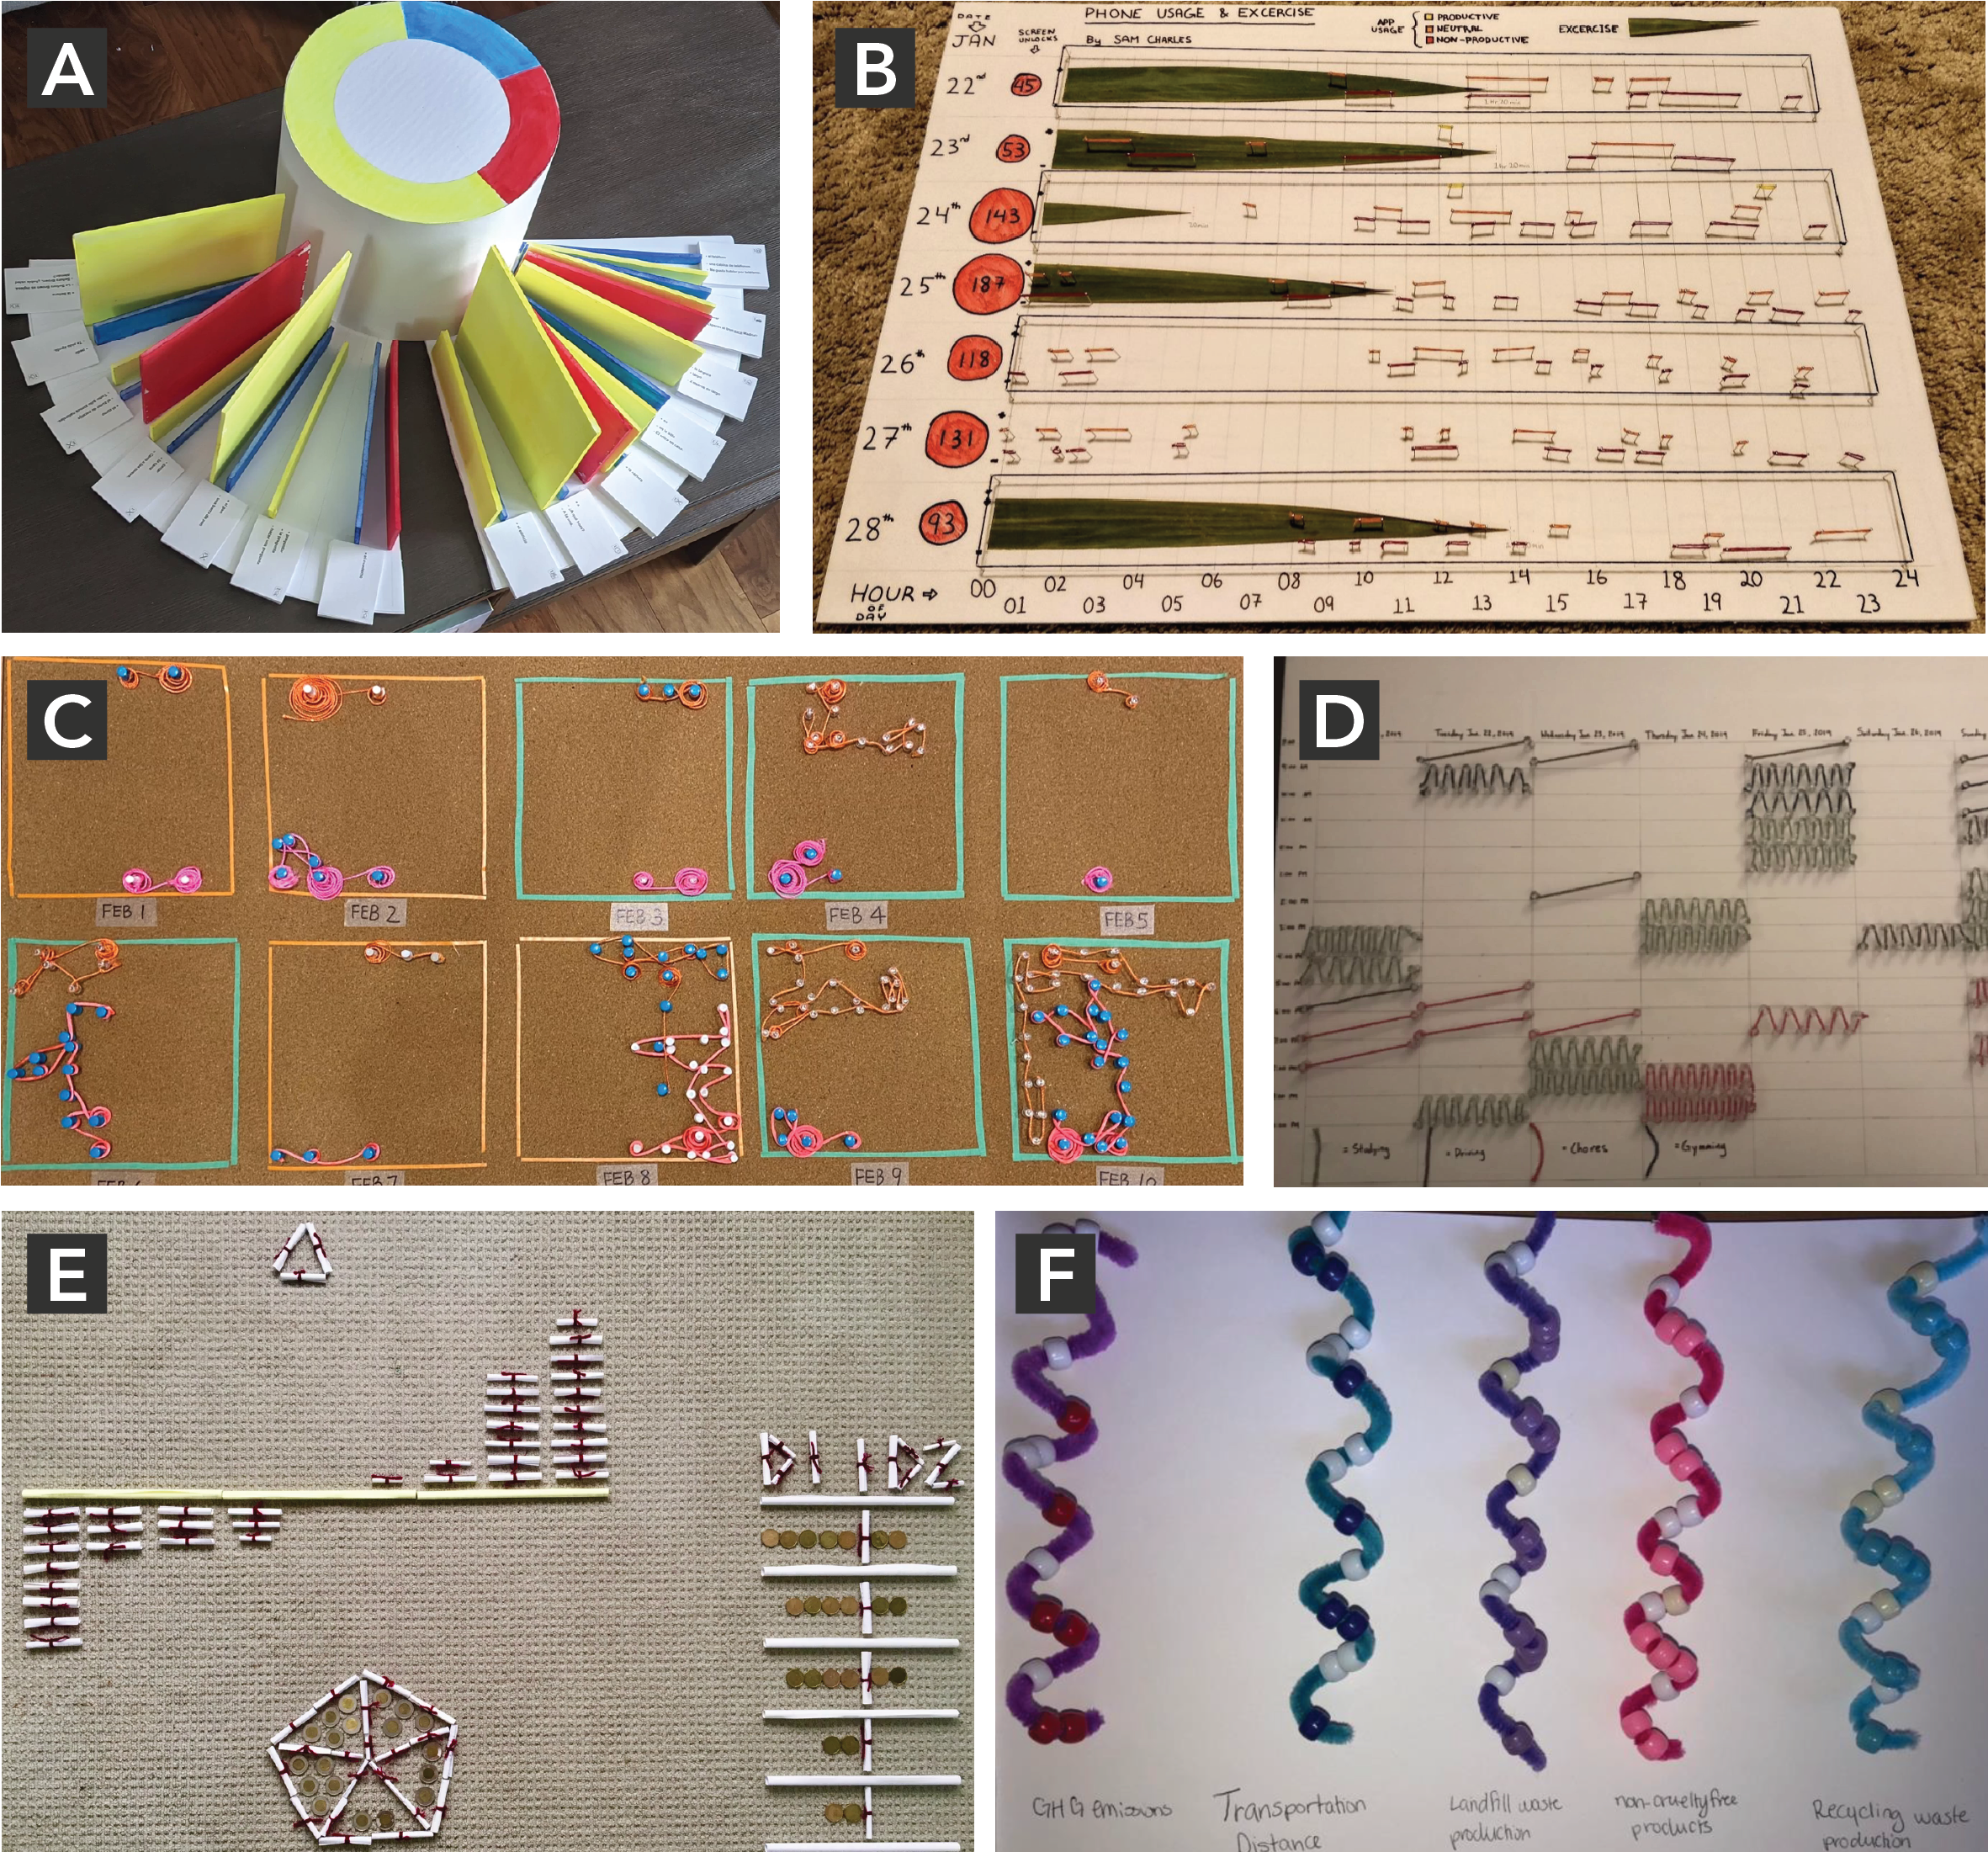
Images created by students to represent their personal data. Refer to the publication below for image attributions.
I describe the results of implementing a personal data physicalization assignment in an information visualization course for senior undergraduate and graduate students in computer science and software engineering. By collecting data about themselves and representing this data in physical forms, students were able to i) learn about data visualization, ii) design creatively; and iii) learn about themselves. While data physicalization in education has been explored with non-technical and novice audiences, the experience I report in this paper provides evidence that data physicalization also has benefits for technical, visualization-savvy students.
Also check out our entry 2010 – Data Sculptures in Class.
Sources:- Charles Perin. What Students Learn with Personal Data Physicalization. CG&A SPecial Issue on Visualization Education, 2021.10.1109/MCG.2021.3115417. Author pre-print available at https://hal.inria.fr/hal-03360714.
- Charles Perin. Personal Data Physicalization assignment v1. University of Victoria Information Visualization course. 2019.
- Charles Perin. Personal Data Physicalization assignment v2. University of Victoria Information Visualization course. 2021.