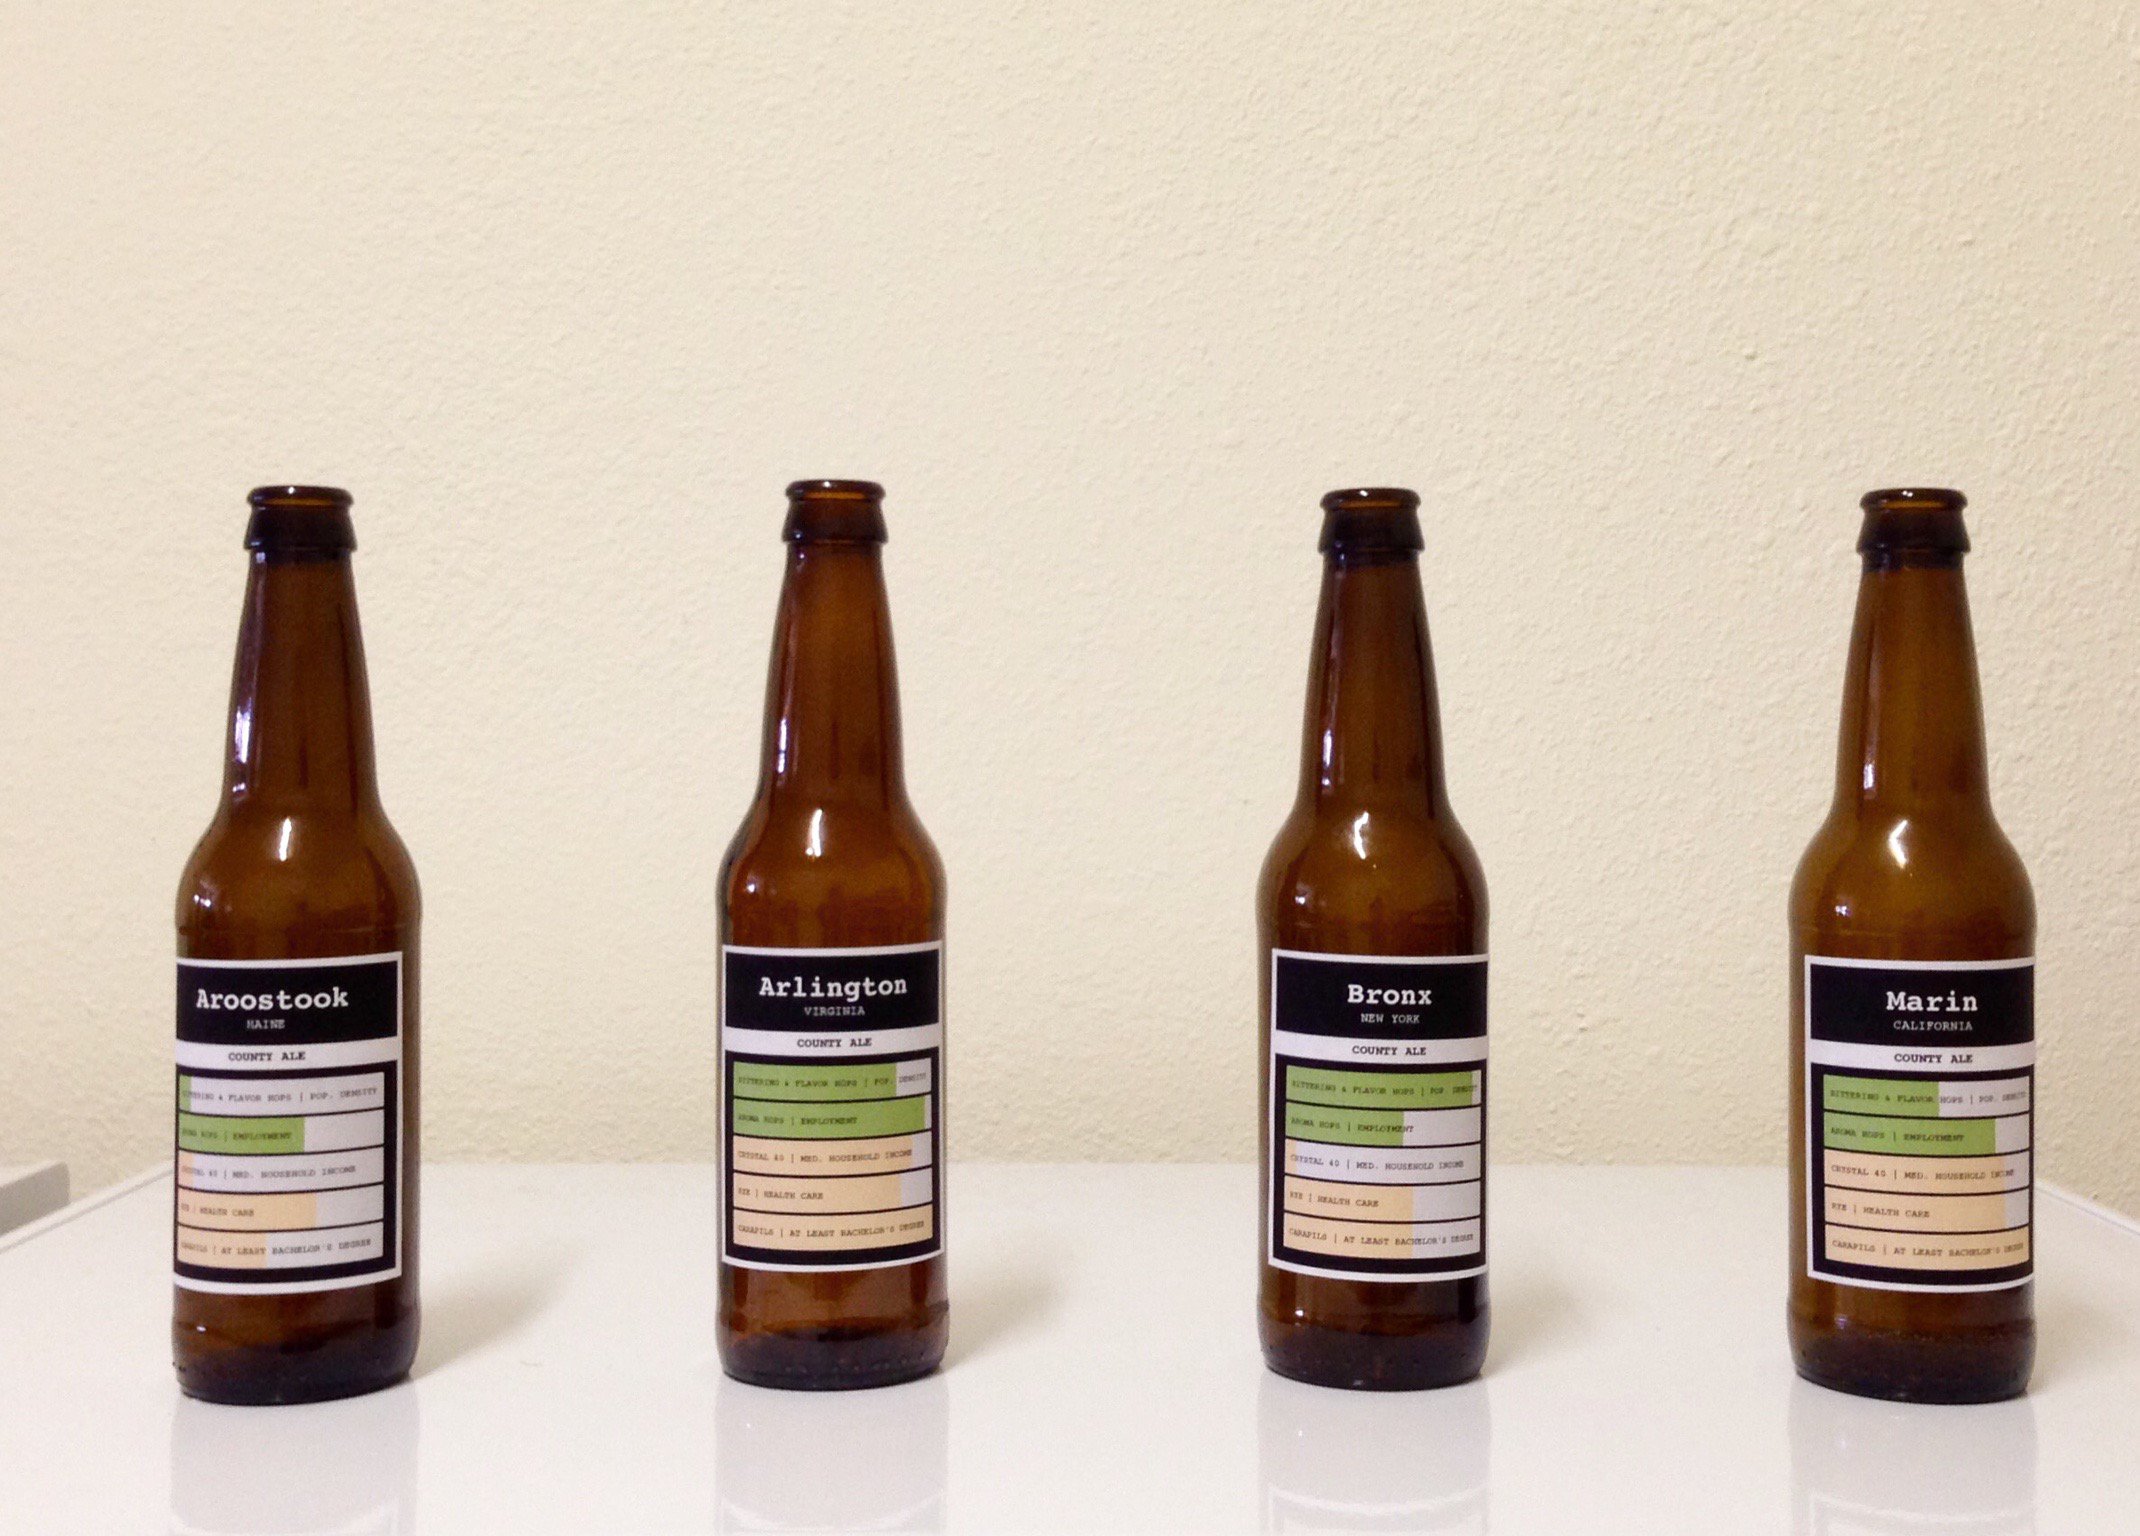
Nathan Yau from flowingdata brewed four different types of beer based on county demographics. For example, he mapped population density to the total amount of hops, and race percentages to the type of hops used. He describes the process in detail on his web site, with R source code.
The idea is reminiscent of Rohit Khot's TastyBeats shown at the CHI '14 conference, an installation that creates personalized energy drinks based on heart beat data. Also see our entry on data cuisine.
Sources:
- Nathan Yau (2015) Brewing Multivariate Beer (via the Partially Derivative podcast).
- Rohit Khot et al (2014) TastyBeats: Making Mocktails with Heart Beats.
Added by: Pierre Dragicevic.
Category:
Passive physical visualization
Tags:
beer, data cuisine, demographics, food