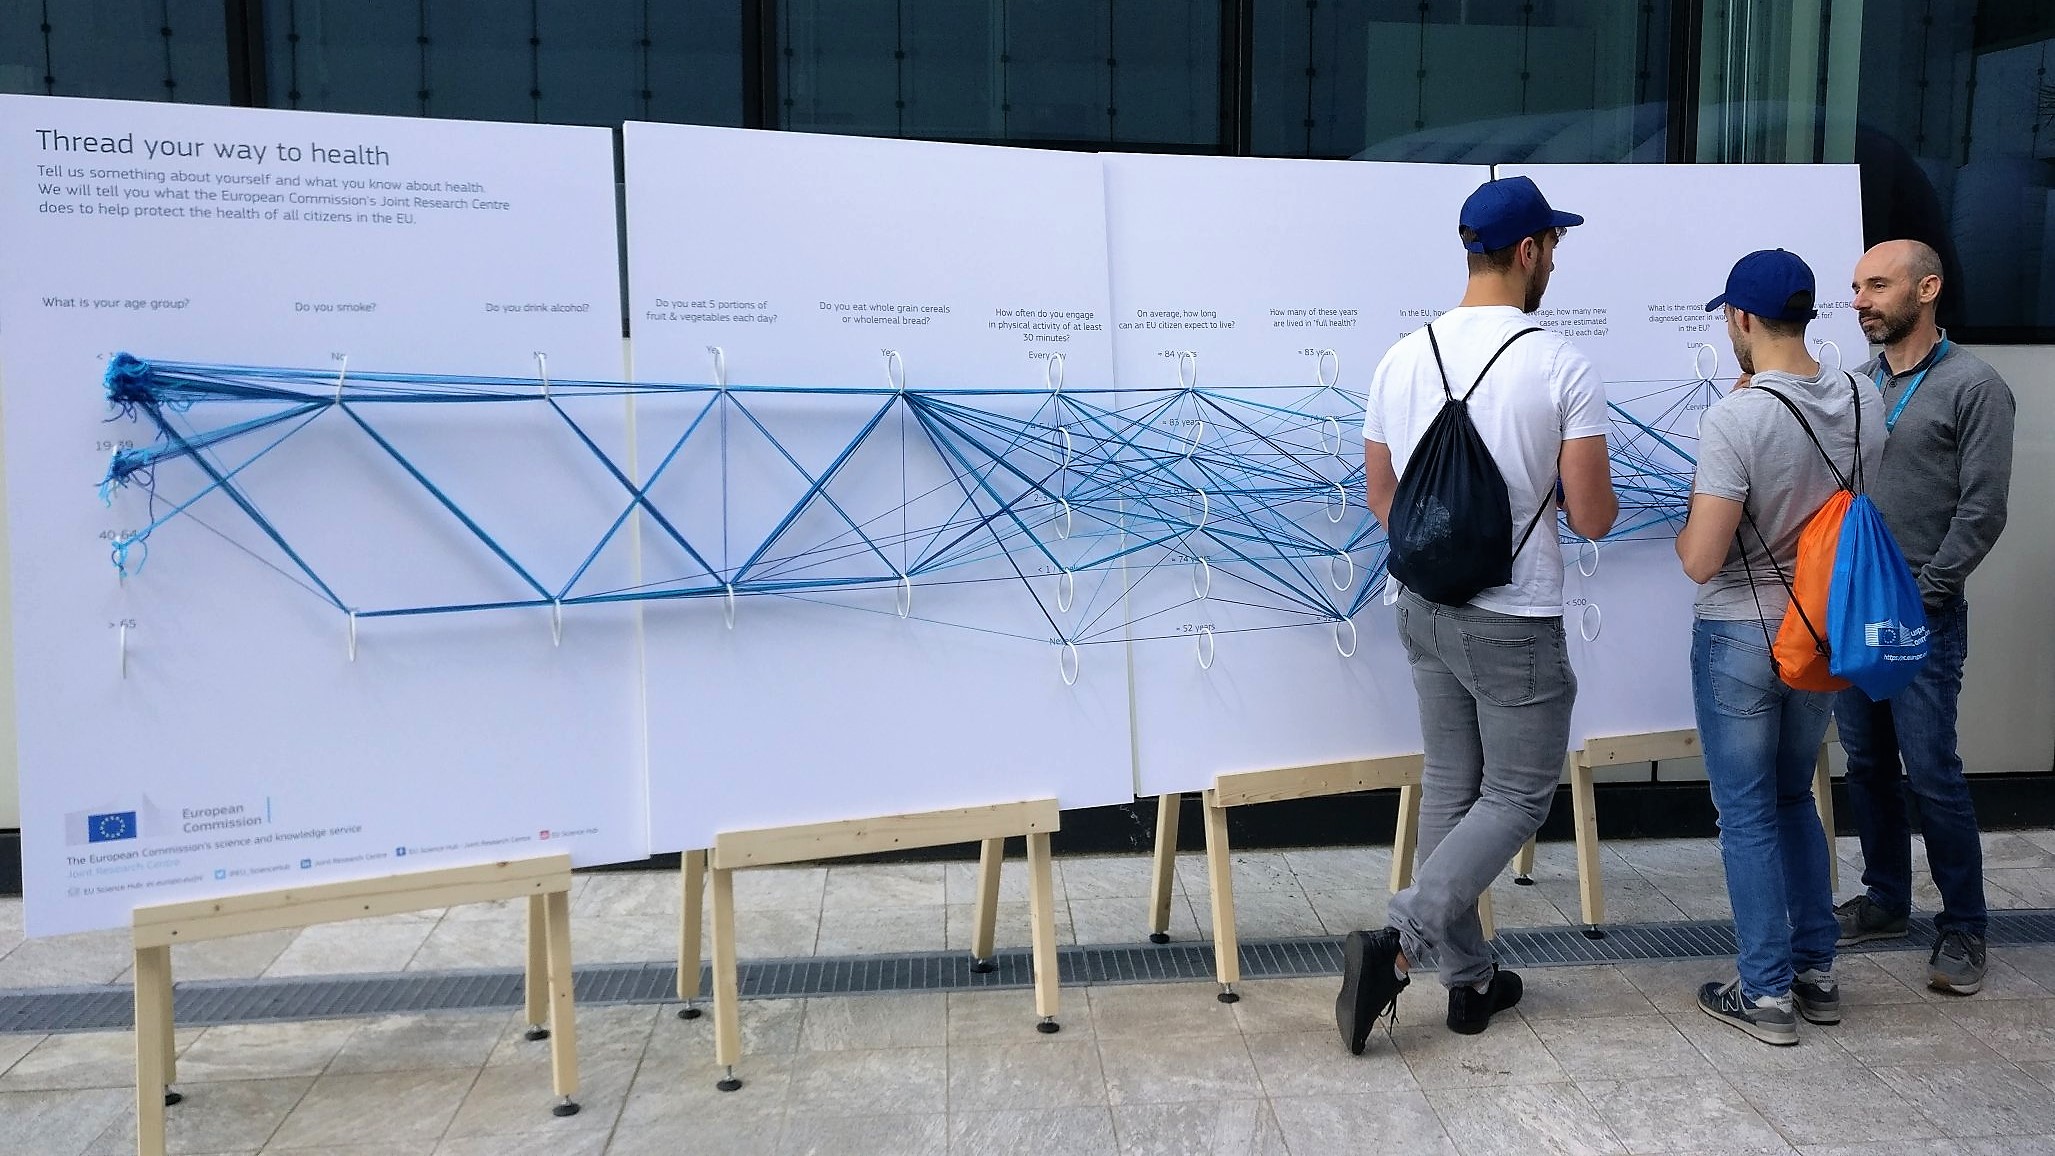
In order to inform a local audience about a largely-avoided topic such as cancer, a research study was commissioned by KnowAndBe.Live, a startup working in the field of cancer prevention awareness, with the aim of fostering a bottom-up information request from a local audience. The research team included a designer, a sociologist and experts on the topic of cancer-prevention, who worked together relying on a collaborative design approach, with the goal of delineating possible strategies to encourage the search for and retrieval of information on a delicate and largely-avoided topic such as cancer. The project combined participatory data physicalization (PDP), an information-design approach where the geometry or material properties of physical artefacts encode data, with a you-draw-it approach. This term refers to a series of data journalism projects published by the New York Times, which challenged readers in a guessing game regarding specific data connected to the topic. The act of guessing, indeed, facilitates the assimilation of knowledge by arousing curiosity about the right answer (Golman, & Loewenstein, 2015). Combining these two approaches we designed an experience that involved the local audience of the TedMed 2017 in Milan in confronting the topic of cancer; the experience triggered a bottom-up demand for information which was answered by offering participants a well-designed information booklet. In 2019 the project has been adopted by the EU Joint Research Centre as a tool to raise awareness on cancer prevention.
Also see our other entries on participatory data physicalizations.
Sources:
- https://www.knowandbe.live/
- https://www.nytimes.com/interactive/2017/01/15/us/politics/you-draw-obama-legacy.html
- Golman, & Loewenstein, 2015. Curiosity, Information Gaps, and the Utility of Knowledge.