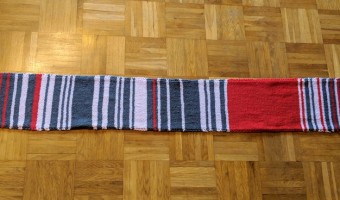
The mother [of] Sara Weber knitted this scarf during her daily train rides to work in Munich and used different colors depending on train delays. Every day two rows: Grey, less than 5 minutes delay. Pink, 5 to 30 minutes delay. Red, both rides delayed or one more than 30 minutes. The huge red area was during construction work, where the train was substituted by a bus. Side note: The tweet went viral and at the end she sold the scarf at eBay and gave the money to the "Bahnhofsmission" who take […]
The mother [of] Sara Weber knitted this scarf during her daily train rides to work in Munich and used different colors depending on train delays. Every day two rows: Grey, less than 5 minutes delay. Pink, 5 to 30 minutes delay. Red, both rides delayed or one more than 30 minutes. The huge red area was during construction work, where the train was substituted by a bus. Side note: The tweet went viral and at the end she sold the scarf at eBay and gave the money to the "Bahnhofsmission" who take care of homeless people at trainstations. Sources:
Sara Weber on Twitter: https://twitter.com/sara__weber/status/1081950904671240192 Zett Newspage: https://ze.tt/mit-einem-selbst-gestrickten-schal-zeigt-eine-pendlerin-wie-haeufig-ihre-bahn-verspaetung-hat/
Added by: Steffen Haesler.
Category:
Passive physical visualization
Tags:
data clothing, delays, fabric, knitting, textile, transportation