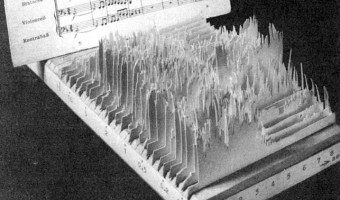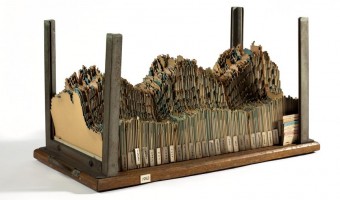
A 3D chart made out of a jagged cardboard for each year representing generated electricity and demand over time. Three-dimensional chart used by Central Electricity Generating Board planners, c.1954. Consists of about 300 cards with square-cut stepped edges in an enclosure of chrome steel uprights, mounted on a wooden base, with a handle at each end. Data represented from October 1951 to April 1954. An early example of 3D data visualisation [...] Also see our entry 1935 - 3D Visualizations of […]
A 3D chart made out of a jagged cardboard for each year representing generated electricity and demand over time. Three-dimensional chart used by Central Electricity Generating Board planners, c.1954. Consists of about 300 cards with square-cut stepped edges in an enclosure of chrome steel uprights, mounted on a wooden base, with a handle at each end. Data represented from October 1951 to April 1954. An early example of 3D data visualisation [...] Also see our entry 1935 - 3D Visualizations of Power Consumption. Sources: Alice Cliff and Jenny Rinkinen (2018) Visualising electricity demand: use and users of a 3D chart from the 1950s. (CC-BY-NC-SA) Photos: The Board of Trustees of the Science Museum (link)
Added by: Till Nagel, sent by: Jill Hubley.
Category:
Passive physical visualization
Tags:
3D, cardboard, electricity, power, temporal data