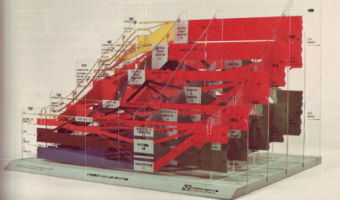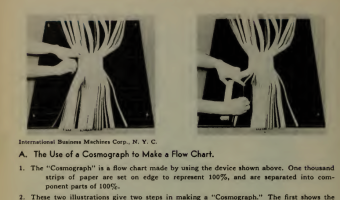
The left image above shows a physical flow chart (Sankey diagram) made of 1000 sheets of paper. It was not meant to be directly read, but to be photographed (see right image). The physical apparatus, called Cosmograph, allowed people without graphic skills to easily produce nice-looking Sankey diagrams. It was copyrighted by IBM in 1933 and sold for $50. Sources: Willard Cope Brinton (1939) Graphic Presentation, p. 78. Jim Strickland (2012) Cosmograph? What's a Cosmograph?
The left image above shows a physical flow chart (Sankey diagram) made of 1000 sheets of paper. It was not meant to be directly read, but to be photographed (see right image). The physical apparatus, called Cosmograph, allowed people without graphic skills to easily produce nice-looking Sankey diagrams. It was copyrighted by IBM in 1933 and sold for $50. Sources: Willard Cope Brinton (1939) Graphic Presentation, p. 78. Jim Strickland (2012) Cosmograph? What's a Cosmograph?
Added by: Pierre Dragicevic.
Category:
Passive physical visualization
Tags:
Brinton, cosmograph, flow chart, Sankey diagram