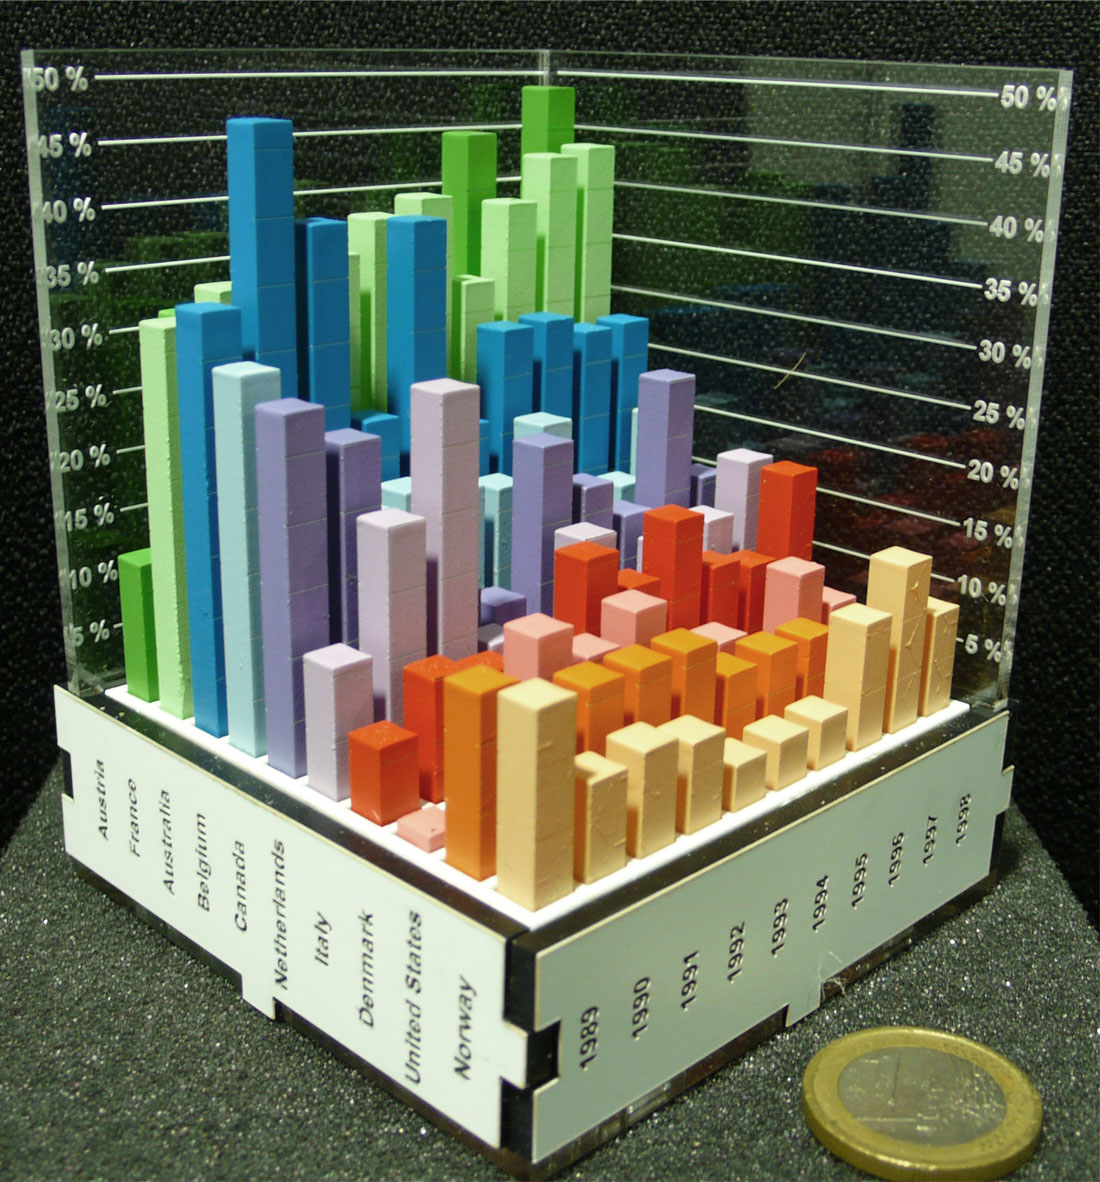

These physical bar charts, showing the evolution of country indicators over time, were used to conduct the first empirical study showing that physical visualizations can outperform their on-screen counterparts for data retrieval tasks.
Sources:
- Yvonne Jansen, Pierre Dragicevic and Jean-Daniel Fekete (2013) Evaluating the Efficiency of Physical Visualizations.
- Also see Yvonne Jansen's PhD dissertation on Physical and Tangible Information Visualization (2014).