
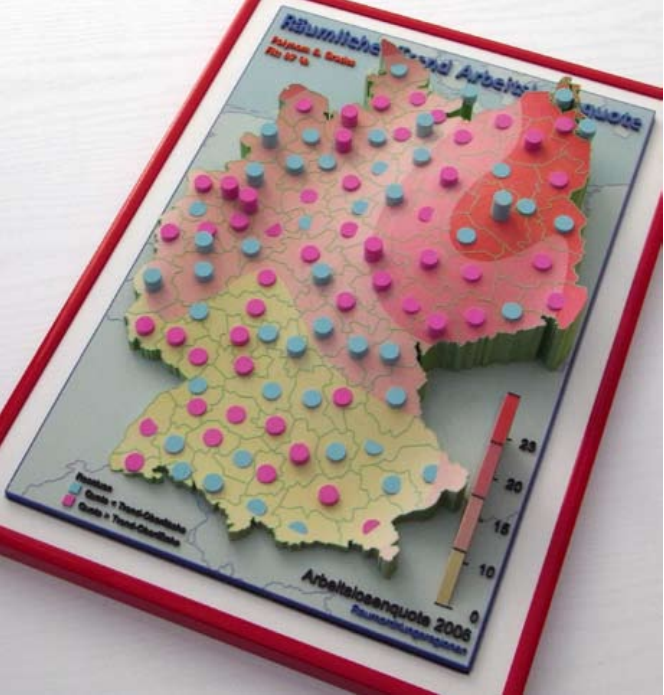
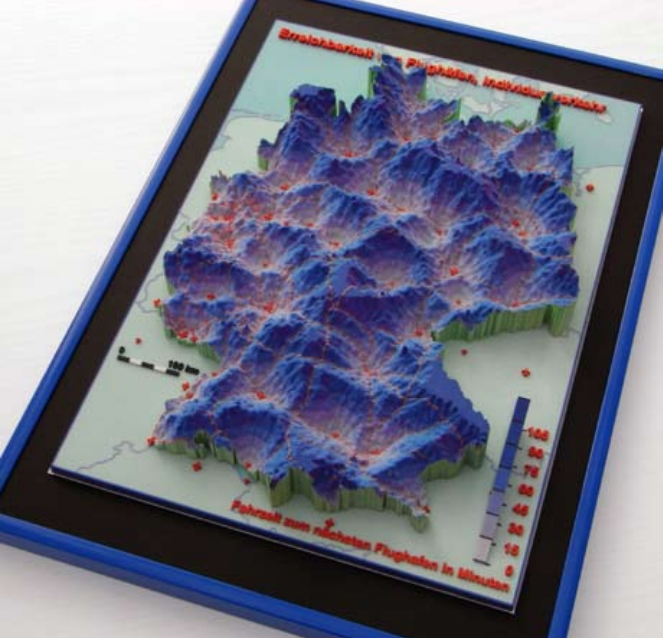
Physical cartographic visualizations built by geographer Wolf-Dieter Rase with a Z650 printer. Left: average prices for building lots in Germany in 2006. Middle: unemployment in Germany in 2006; The surface represent trends, the columns represent local deviations from the trends (magenta means higher, cyan means lower). Right: travel distance to airports.
Source: Wolf-Dieter Rase (2012) Creating Physical 3D Maps Using Rapid Prototyping Techniques.
Added by: Pierre Dragicevic.
Category:
Passive physical visualization
Tags:
3d printing, cartographic