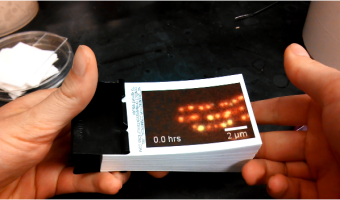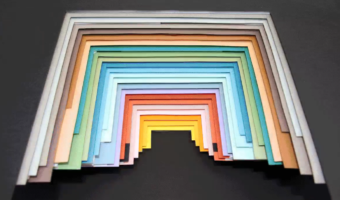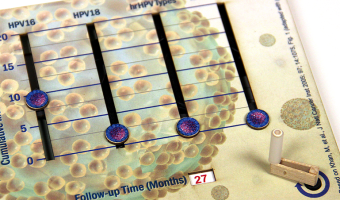
Philadelphia-based multi-discipline artist Bradley Litwin built this physical chart that can be animated by turning a crank. It is the only manually-animated physical visualization we know of so far. It was commissionned by a pharmaceutical company, intended as an educational device for distributing to doctors. Bradley was kind enough to send us an image of the insides of the original prototype, "not quite as pretty as the final product", he says. His explanation: As the crank is turned, a […]
Philadelphia-based multi-discipline artist Bradley Litwin built this physical chart that can be animated by turning a crank. It is the only manually-animated physical visualization we know of so far. It was commissionned by a pharmaceutical company, intended as an educational device for distributing to doctors. Bradley was kind enough to send us an image of the insides of the original prototype, "not quite as pretty as the final product", he says. His explanation: As the crank is turned, a series of radial cams is driven around, each with a profile, derived from the data points along four different indices. The cams actuate cam-followers, which extend to indicators on the corresponding linear, Y axis of the display. The position of the cams is also geared to an elapsed time display, which is the X axis of the graph. If you like cams, also see our entry on ballistic cams from the 1950s. Source: Bradley Litwin.
Added by: Yvonne Jansen & Pierre Dragicevic.
Category:
Passive physical visualization
Tags:
animation, mechanical interaction, science