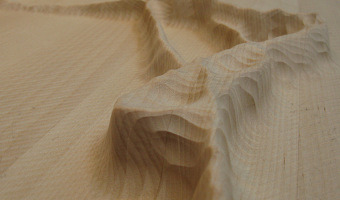
Windcuts is a physical information visualisation retelling the Helsinki wind's travels over five days, using wind sensor measurements from Helsinki, and wood and a CNC machine to cut it from there too. [...] The line's direction shows the wind's direction, the line's width shows the wind's speed - a more intense wind makes a bigger line - and the line's height shows the wind's temperature. Source: Miska Knapek (2012) Windcuts.
Windcuts is a physical information visualisation retelling the Helsinki wind's travels over five days, using wind sensor measurements from Helsinki, and wood and a CNC machine to cut it from there too. [...] The line's direction shows the wind's direction, the line's width shows the wind's speed - a more intense wind makes a bigger line - and the line's height shows the wind's temperature. Source: Miska Knapek (2012) Windcuts.
Added by: Pierre Dragicevic, sent by: Miska Knapek.
Category:
Passive physical visualization
Tags:
digital fabrication, Helskini, weather, wind, wooden