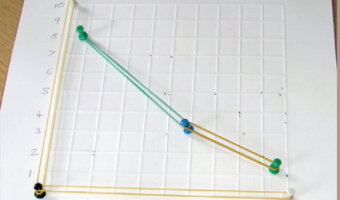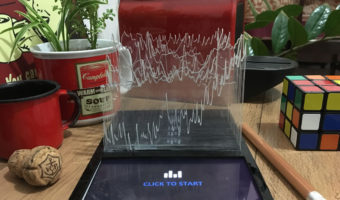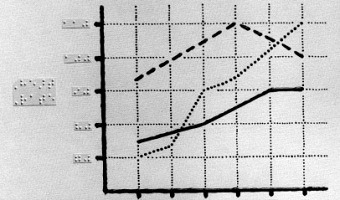
In 1994 the American Printing House for the Blind publishes a short guidebook explaining how to convey infographics for the blind using tactile graphics (first and second images). Most of it is inspired by a 1992 book by Polly Edman. Although it's not clear when were the first tactile infographics created, (non-thematic) tactile maps already existed in the 1910s (right image). Sources: APH (American Printing House for the Blind), Inc. (1994) Tactile Graphics Starter Kit. Polly Edman (1992) […]
In 1994 the American Printing House for the Blind publishes a short guidebook explaining how to convey infographics for the blind using tactile graphics (first and second images). Most of it is inspired by a 1992 book by Polly Edman. Although it's not clear when were the first tactile infographics created, (non-thematic) tactile maps already existed in the 1910s (right image). Sources: APH (American Printing House for the Blind), Inc. (1994) Tactile Graphics Starter Kit. Polly Edman (1992) Tactile Graphics. First and second image from the Tactile Graphics Starter Kit. Right image: Library of Congress, Map of Europe, for Blind (thanks to Evan Tachovsky for digging this out).
Added by: Pierre Dragicevic.
Category:
Passive physical visualization
Tags:
accessibility, blind, cartographic, tactile graphics