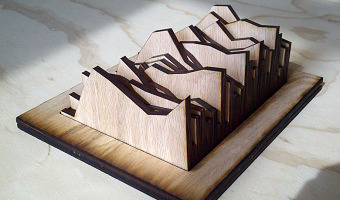
This data sculpture created by Nilam Ram from the Studio|Lab team at Penn State University shows the evolution of cortisol levels for 34 people after they experienced a stressful situation. Source: Nilam Ram (2013) Cortisol Data Sculpture.
This data sculpture created by Nilam Ram from the Studio|Lab team at Penn State University shows the evolution of cortisol levels for 34 people after they experienced a stressful situation. Source: Nilam Ram (2013) Cortisol Data Sculpture.
Added by: Pierre Dragicevic.
Category:
Passive physical visualization
Tags:
cortisol, digital fabrication, laser cutting, line charts, medicine, stress, wood